Geodatenanalyse und Einblicke
Zusammenfassung
Wir verwandeln komplexe Geodaten wie Drohnenbilder, Satellitendaten und Feldbeobachtungen mithilfe fortschrittlicher Analytik, KI und über 13 Jahren wissenschaftlicher Expertise in umsetzbare Erkenntnisse.
Through a combination of scientific methods and AI-powered analytics, we deliver results that are both reliable and scalable — from vegetation and land-cover classification to carbon estimation, change detection, and environmental monitoring.
With more than 13 years of experience in remote sensing and geospatial science, we provide the clarity and context needed for sustainable planning, infrastructure development, and natural resource management.
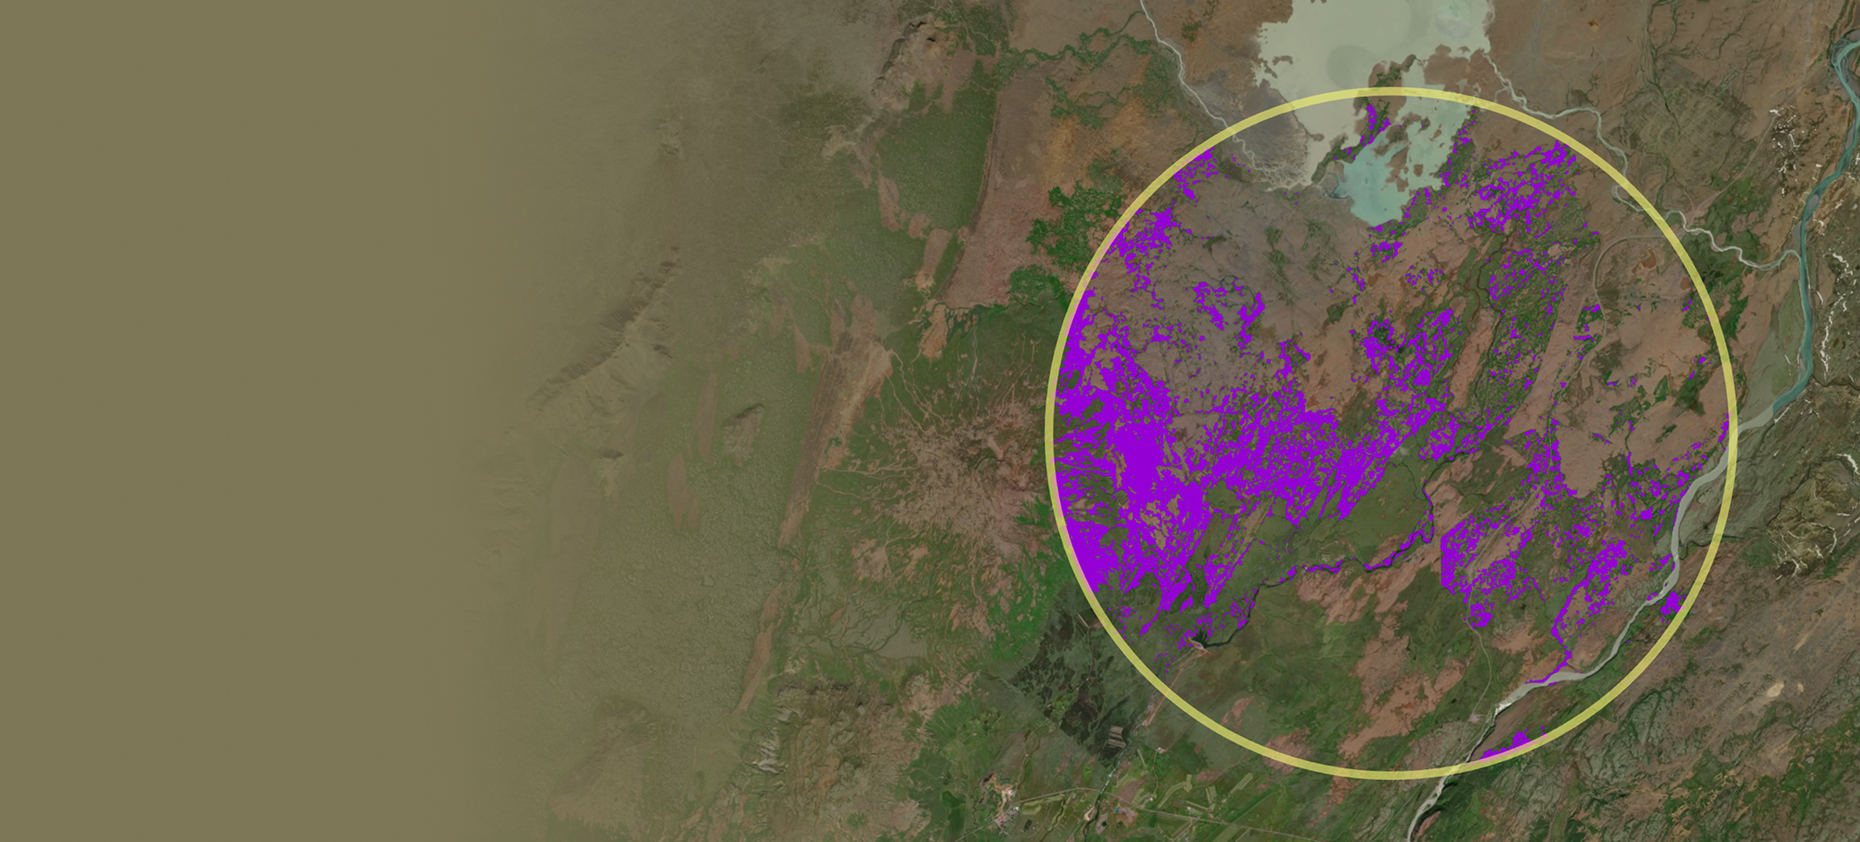
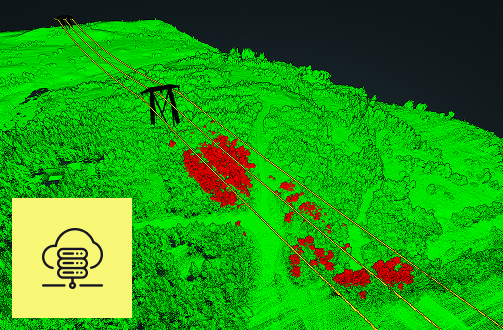
32%
TOTAL INVASIVE SPECIES COVERAGE
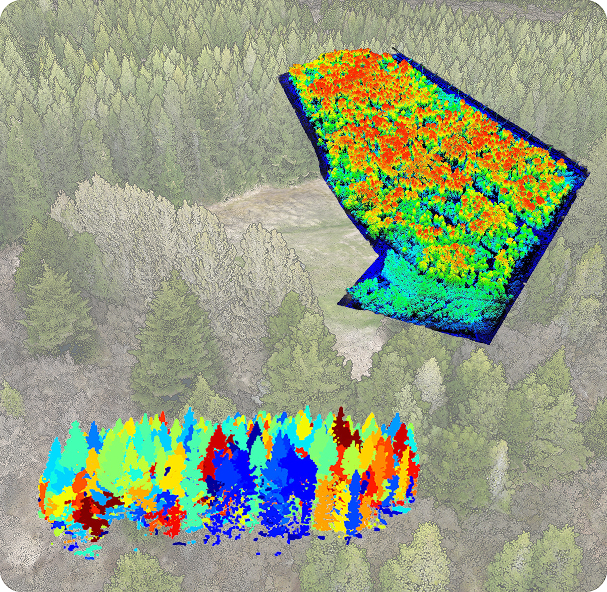
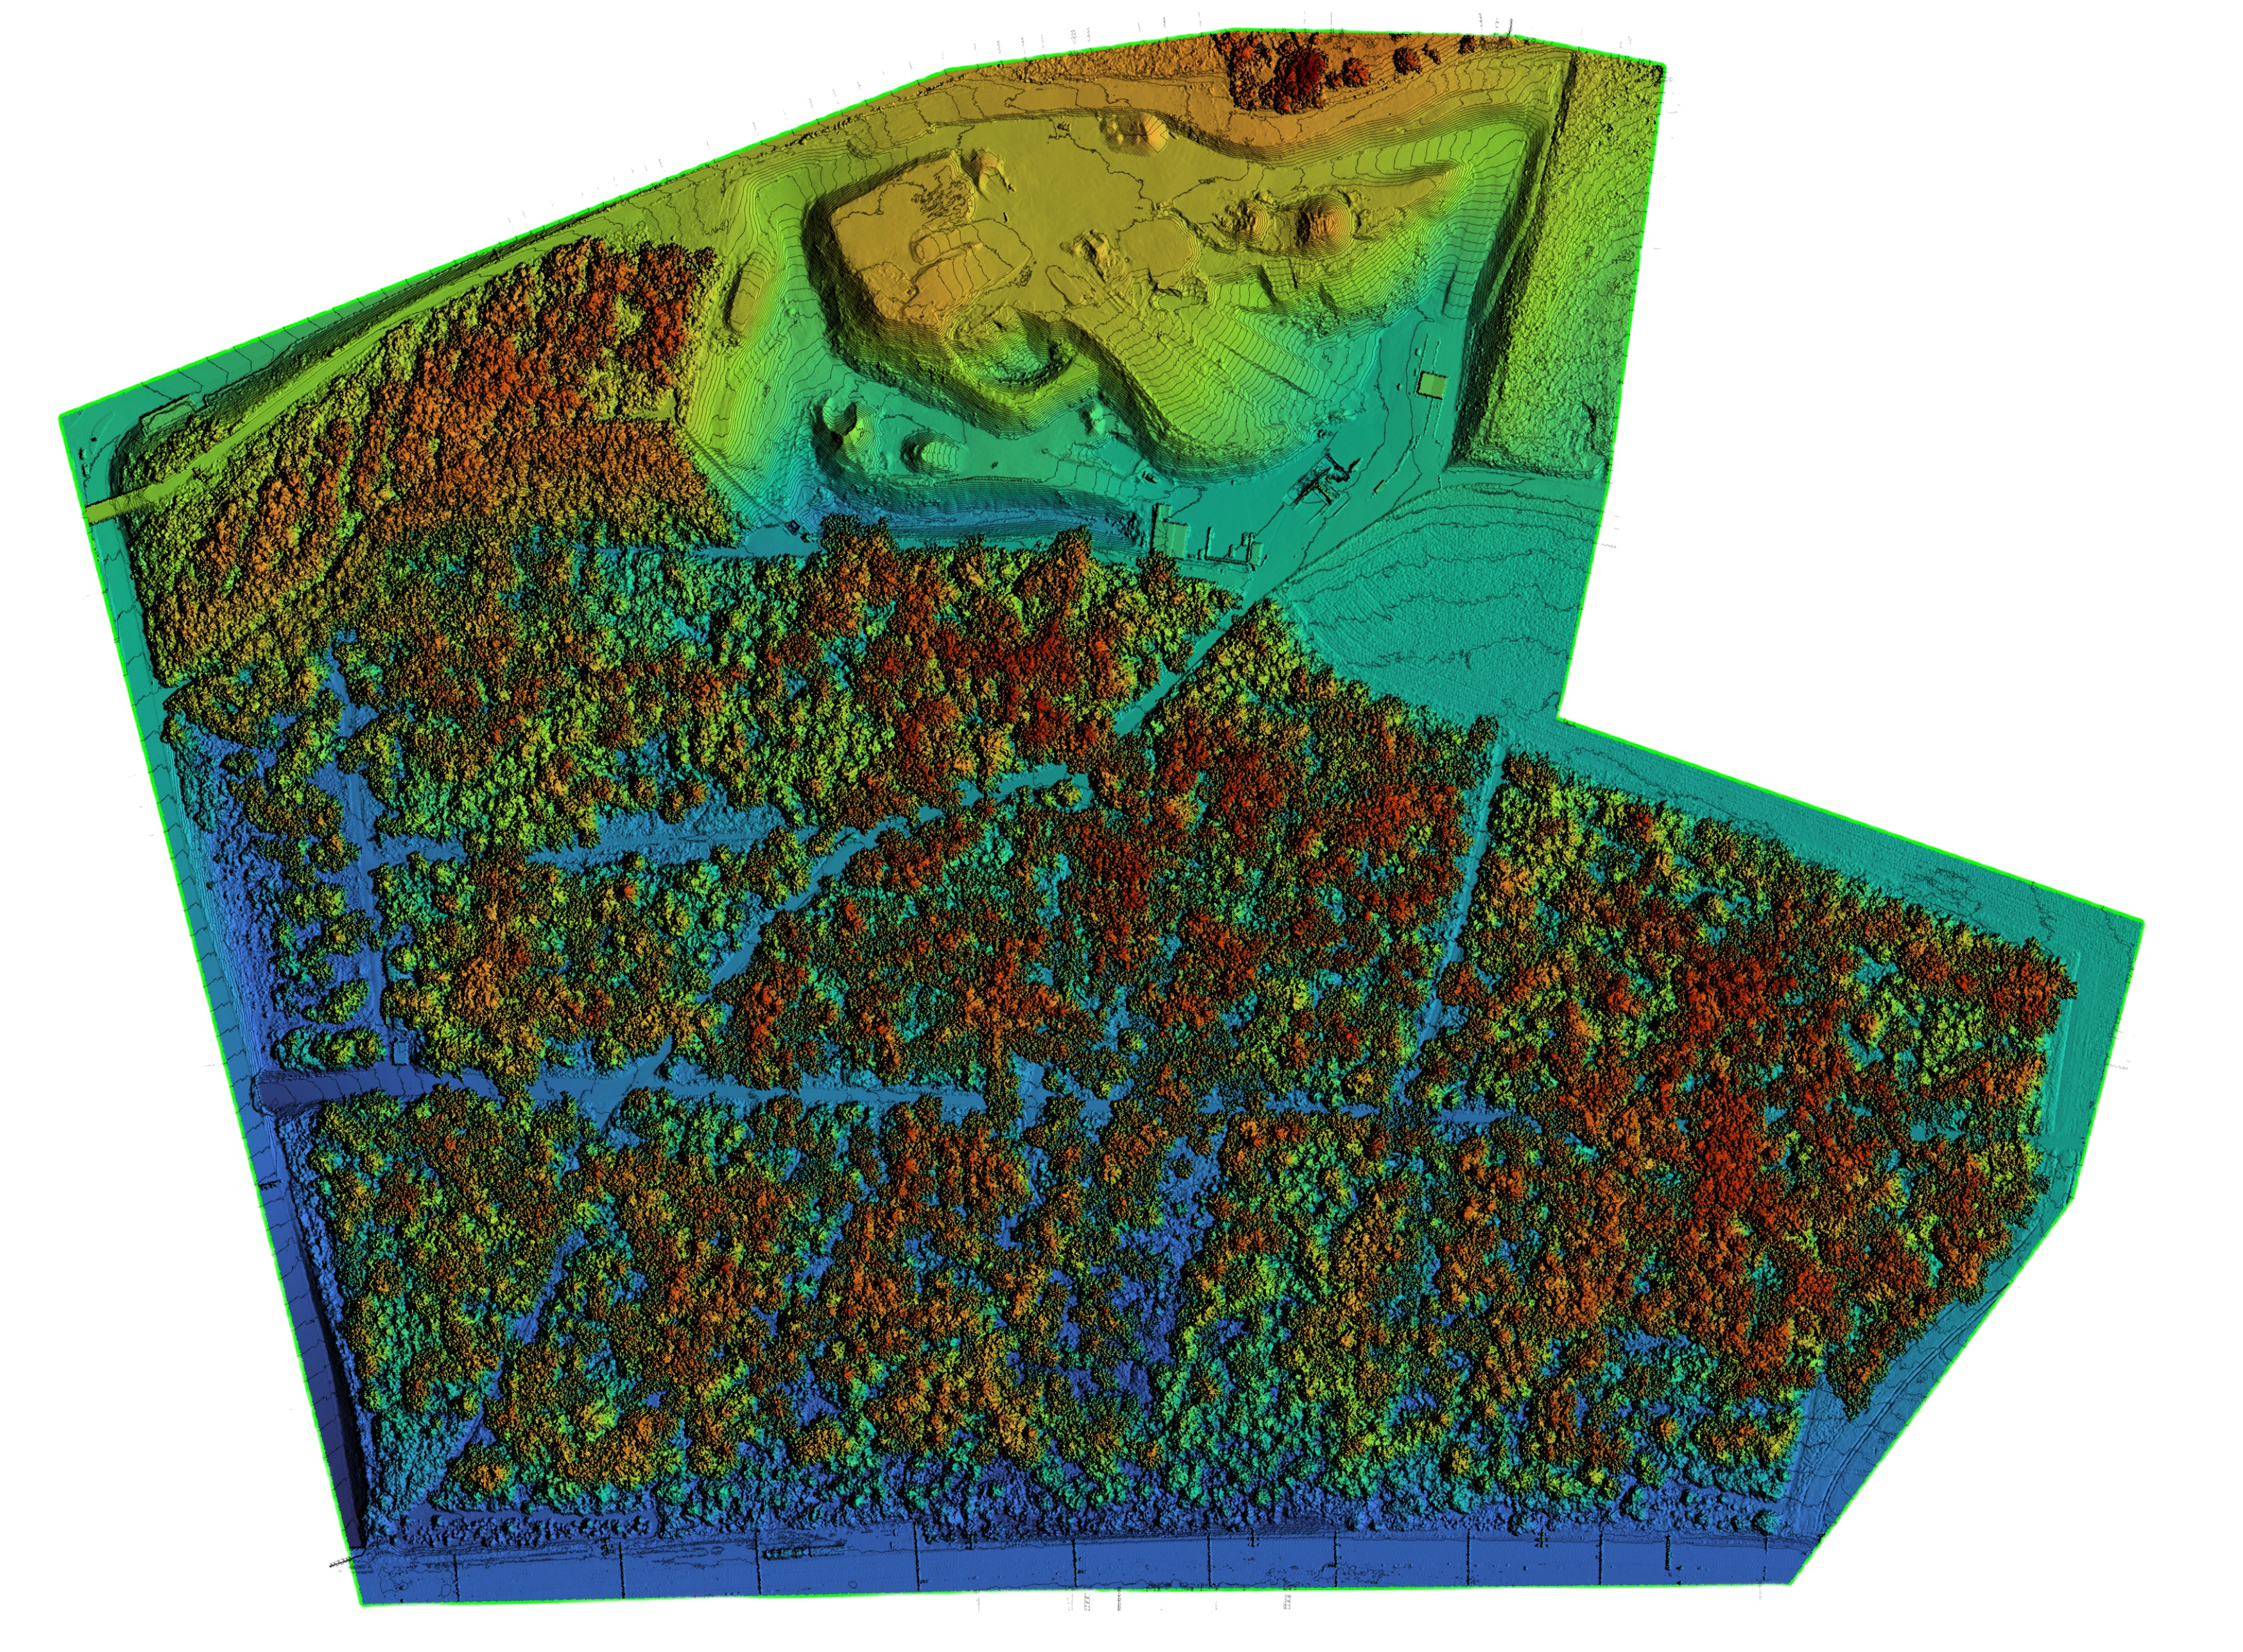
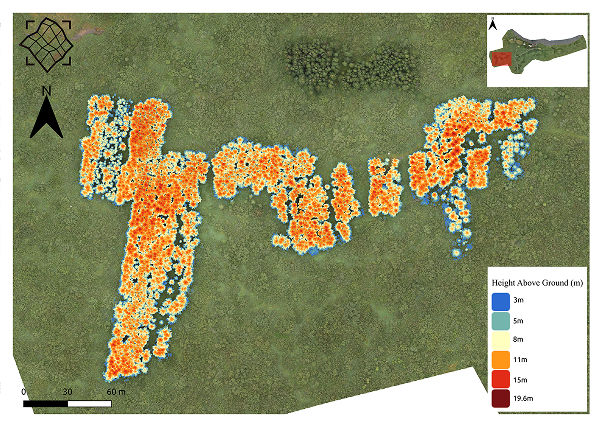
Forest Inventory
Our forest inventory service provides accurate and detailed information about forests using drone and LiDAR data. We identify and classify individual trees, measure their height above ground, analyze forest density and health, and generate detailed terrain and canopy models. The result is a complete overview of the forest structure and condition — supporting better planning, management, and environmental decision-making.
What we Deliver
Tree detection and classification – Identify and classify individual trees using fused LiDAR, RGB, multispectral, and hyperspectral data.
Tree height measurement – Calculate minimum, maximum, and average tree heights relative to the ground surface.
Forest density and structure mapping – Visualize tree distribution and canopy coverage to understand forest composition and growth patterns.
Forest health analysis – Detect variations in canopy condition and identify signs of stress or change over time.
Carbon estimation – Use LiDAR-derived structure and regression models to estimate above-ground biomass and carbon storage.
Key Benefits
Save time and resources compared to traditional field inventories.– Identify and classify individual trees using fused LiDAR, RGB, multispectral, and hyperspectral data.
Access detailed, repeatable forest metrics for planning, management, and reporting.
Monitor forest health and biomass to support sustainability and carbon tracking goals.
Enhance terrain understanding for infrastructure and land-use planning.– Detect variations in canopy condition and identify signs of stress or change over time.
Receive ready-to-use GIS-compatible data for decision-making and integration with other systems.
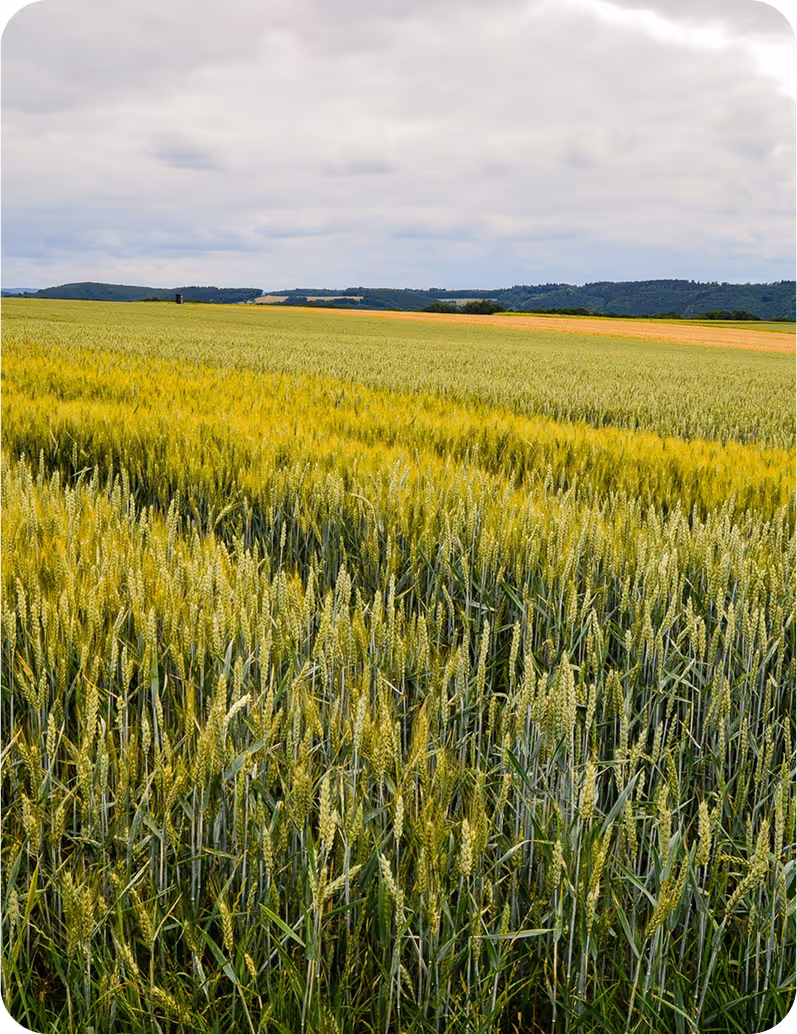
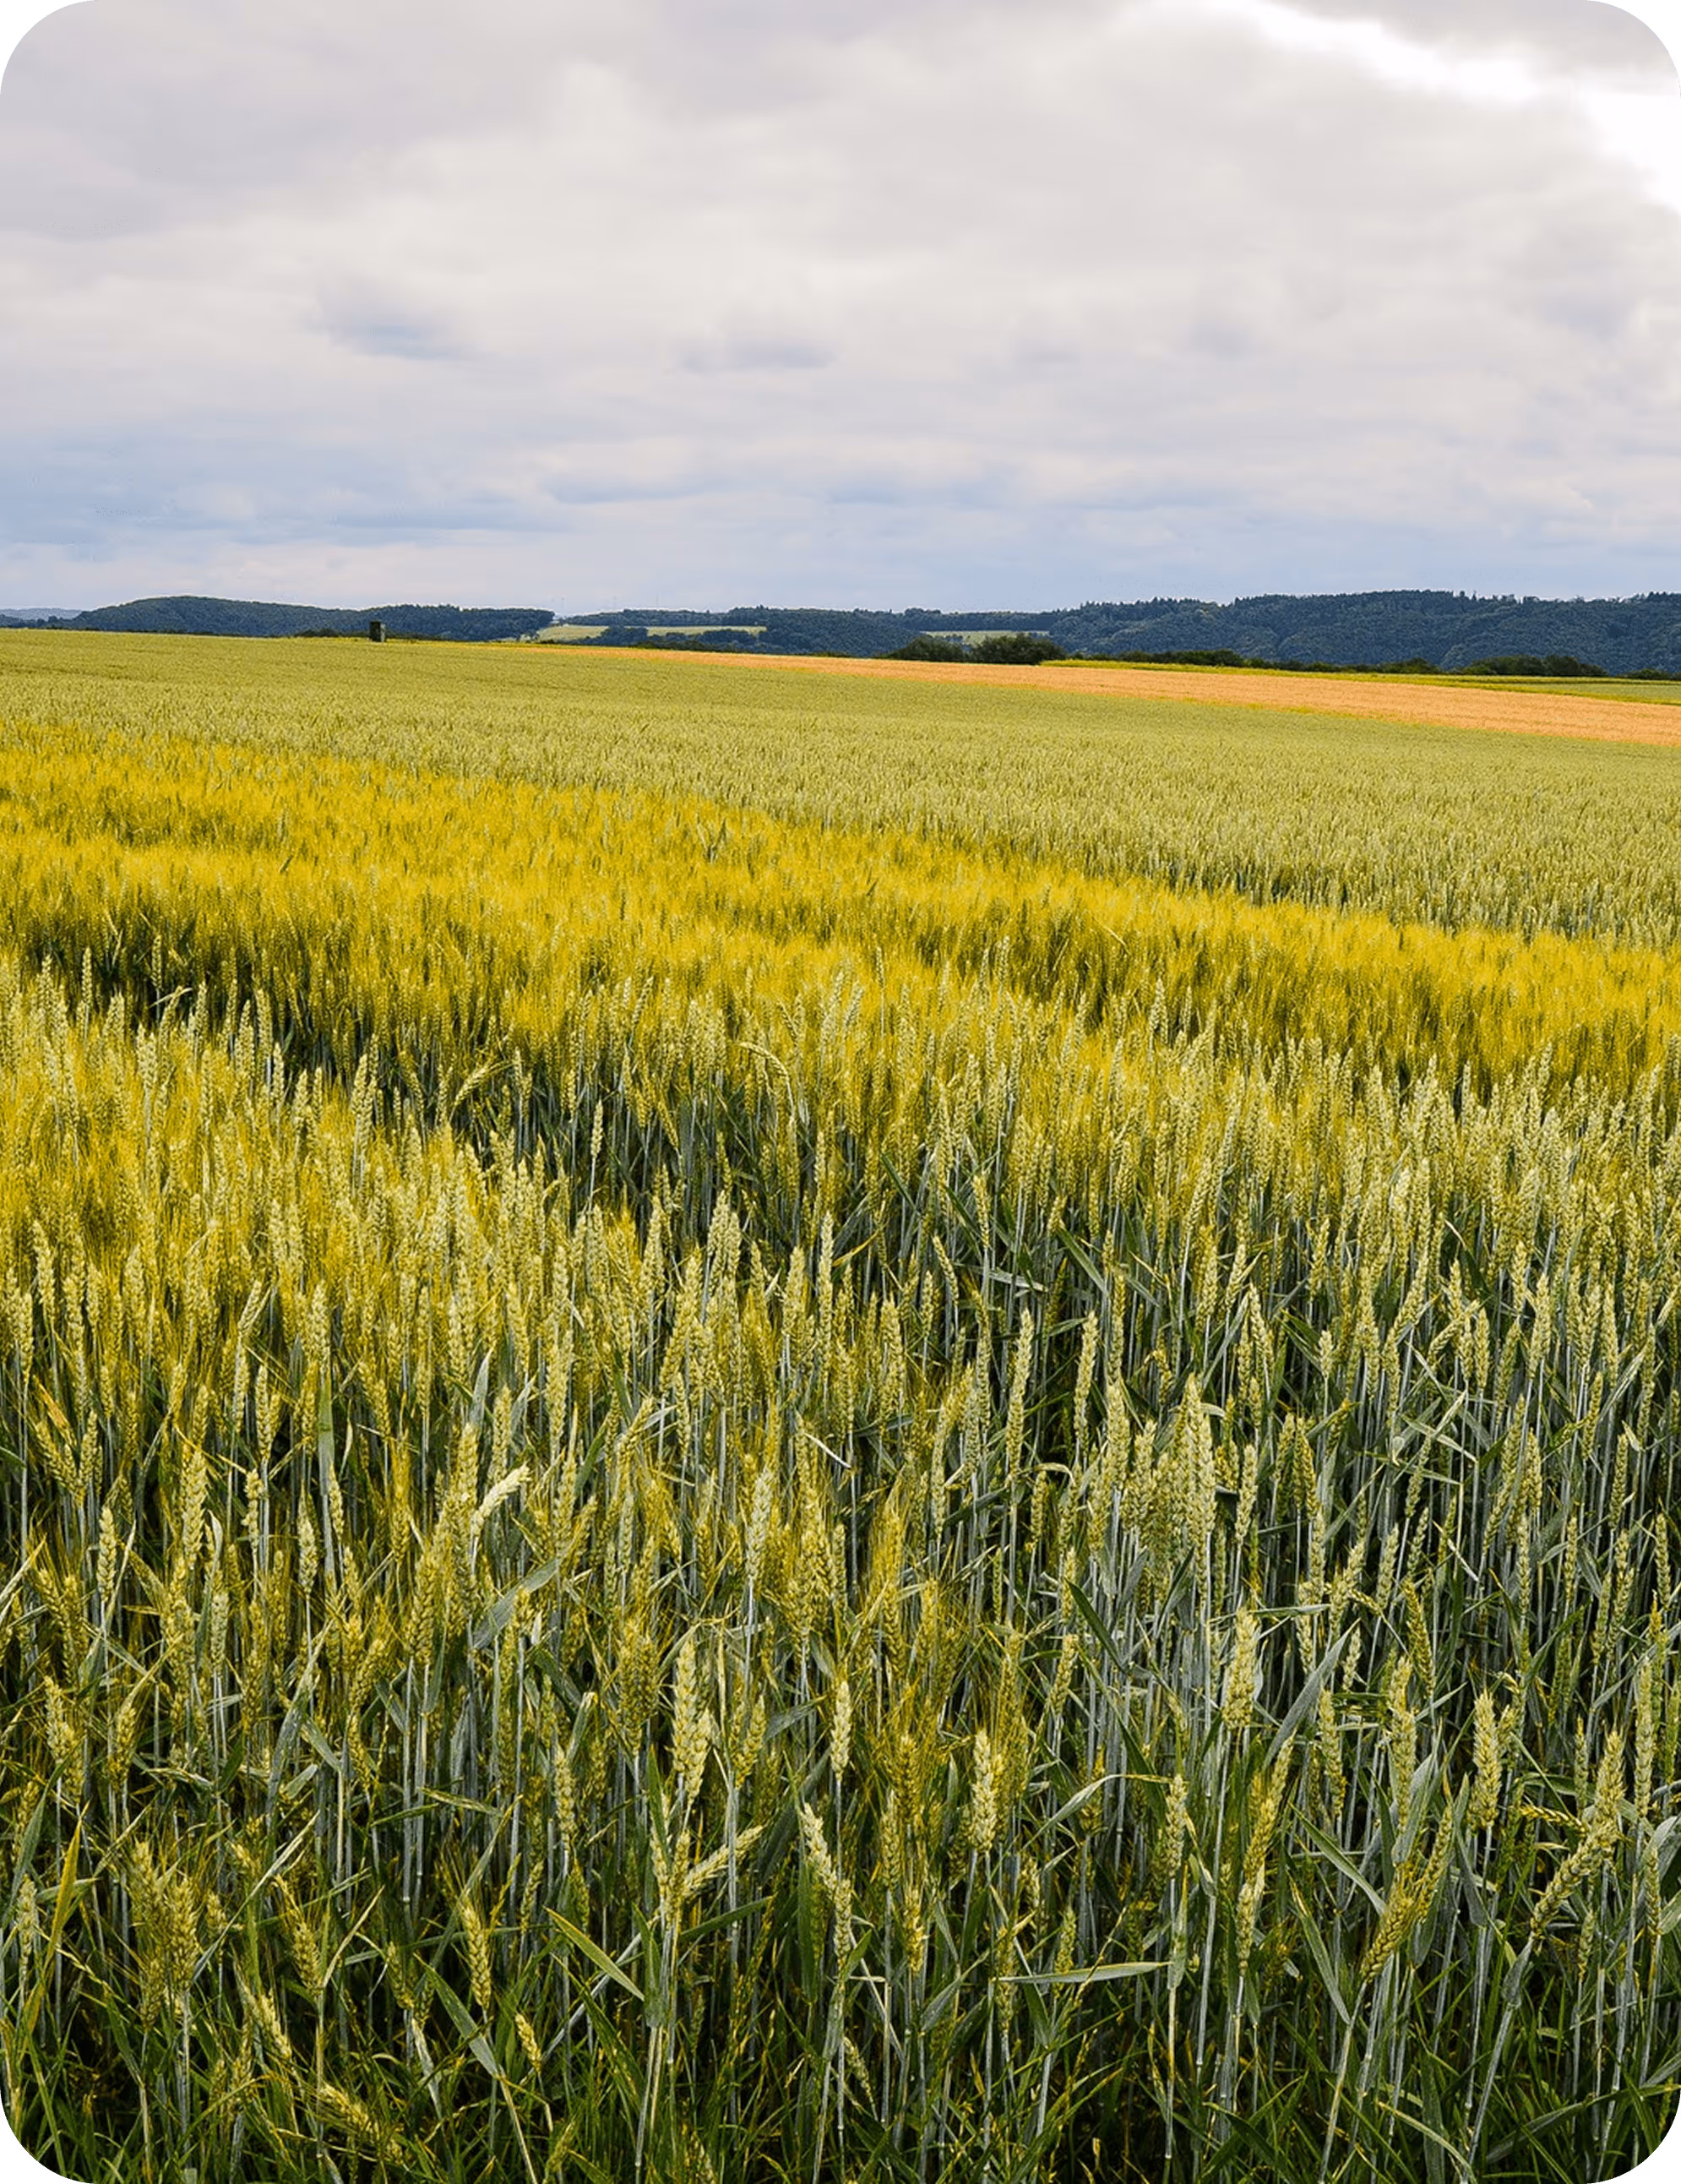
Vegetation Classification and Mapping
Our vegetation classification service delivers detailed maps of plant cover and types using drone, satellite, and spectral data. We tailor each project to the specific vegetation and environment, selecting the best method to achieve accurate results. The outcome is a precise, visual layer showing vegetation distribution that can be explored in DATACT or any GIS platform — supporting better planning, conservation, and environmental insight.
What we Deliver
Custom classification – We can classify nearly any vegetation type, from grasslands and wetlands to shrubs, forests, and crops.Identify and classify individual trees using fused LiDAR, RGB, multispectral, and hyperspectral data.
Tailored approach – The method is chosen based on the vegetation characteristics, area size, and required accuracy — using drone, satellite, or hybrid data.
Detailed vegetation maps – Deliverables include a visual layer and GIS-ready dataset showing vegetation type and coverage.
Seamless operation – We operate under our license, so you get the data without the bureaucracy.Detect variations in canopy condition and identify signs of stress or change over time.
DATACT integration – Results can be viewed, compared, and analyzed directly in DATACT or exported to other GIS platforms.
Protected species identification – Detect and map the presence of important or legally protected plant species before land development or construction.
Invasive species detection – Identify and monitor invasive plants that threaten ecosystems, soil quality, or land value.
Temporal analysis – Compare classifications across time to track vegetation changes, growth, or degradation.Deliverables include a visual layer and GIS-ready dataset showing vegetation type and coverage.
Collaborative workflow – We work closely with local experts and ecologists to ensure biological accuracy and reliable interpretation.
Key Benefits
Support better land-use decisions – Identify ecologically sensitive areas before construction or land change.compared to traditional field inventories.– Identify and classify individual trees using fused LiDAR, RGB, multispectral, and hyperspectral data.
Enable targeted conservation – Map and monitor habitats of protected or endangered species.
Manage invasive plants – Detect and quantify invasive species early to plan control actions.
Monitor ecosystem change – Track vegetation growth, decline, or seasonal dynamics over time.
Save time and cost – Automated analysis replaces lengthy field surveys while maintaining scientific rigor.
Enhance environmental transparency – Provide clear, visual data to stakeholders and regulators.
Satellite view name goes here
Satellite view name goes here
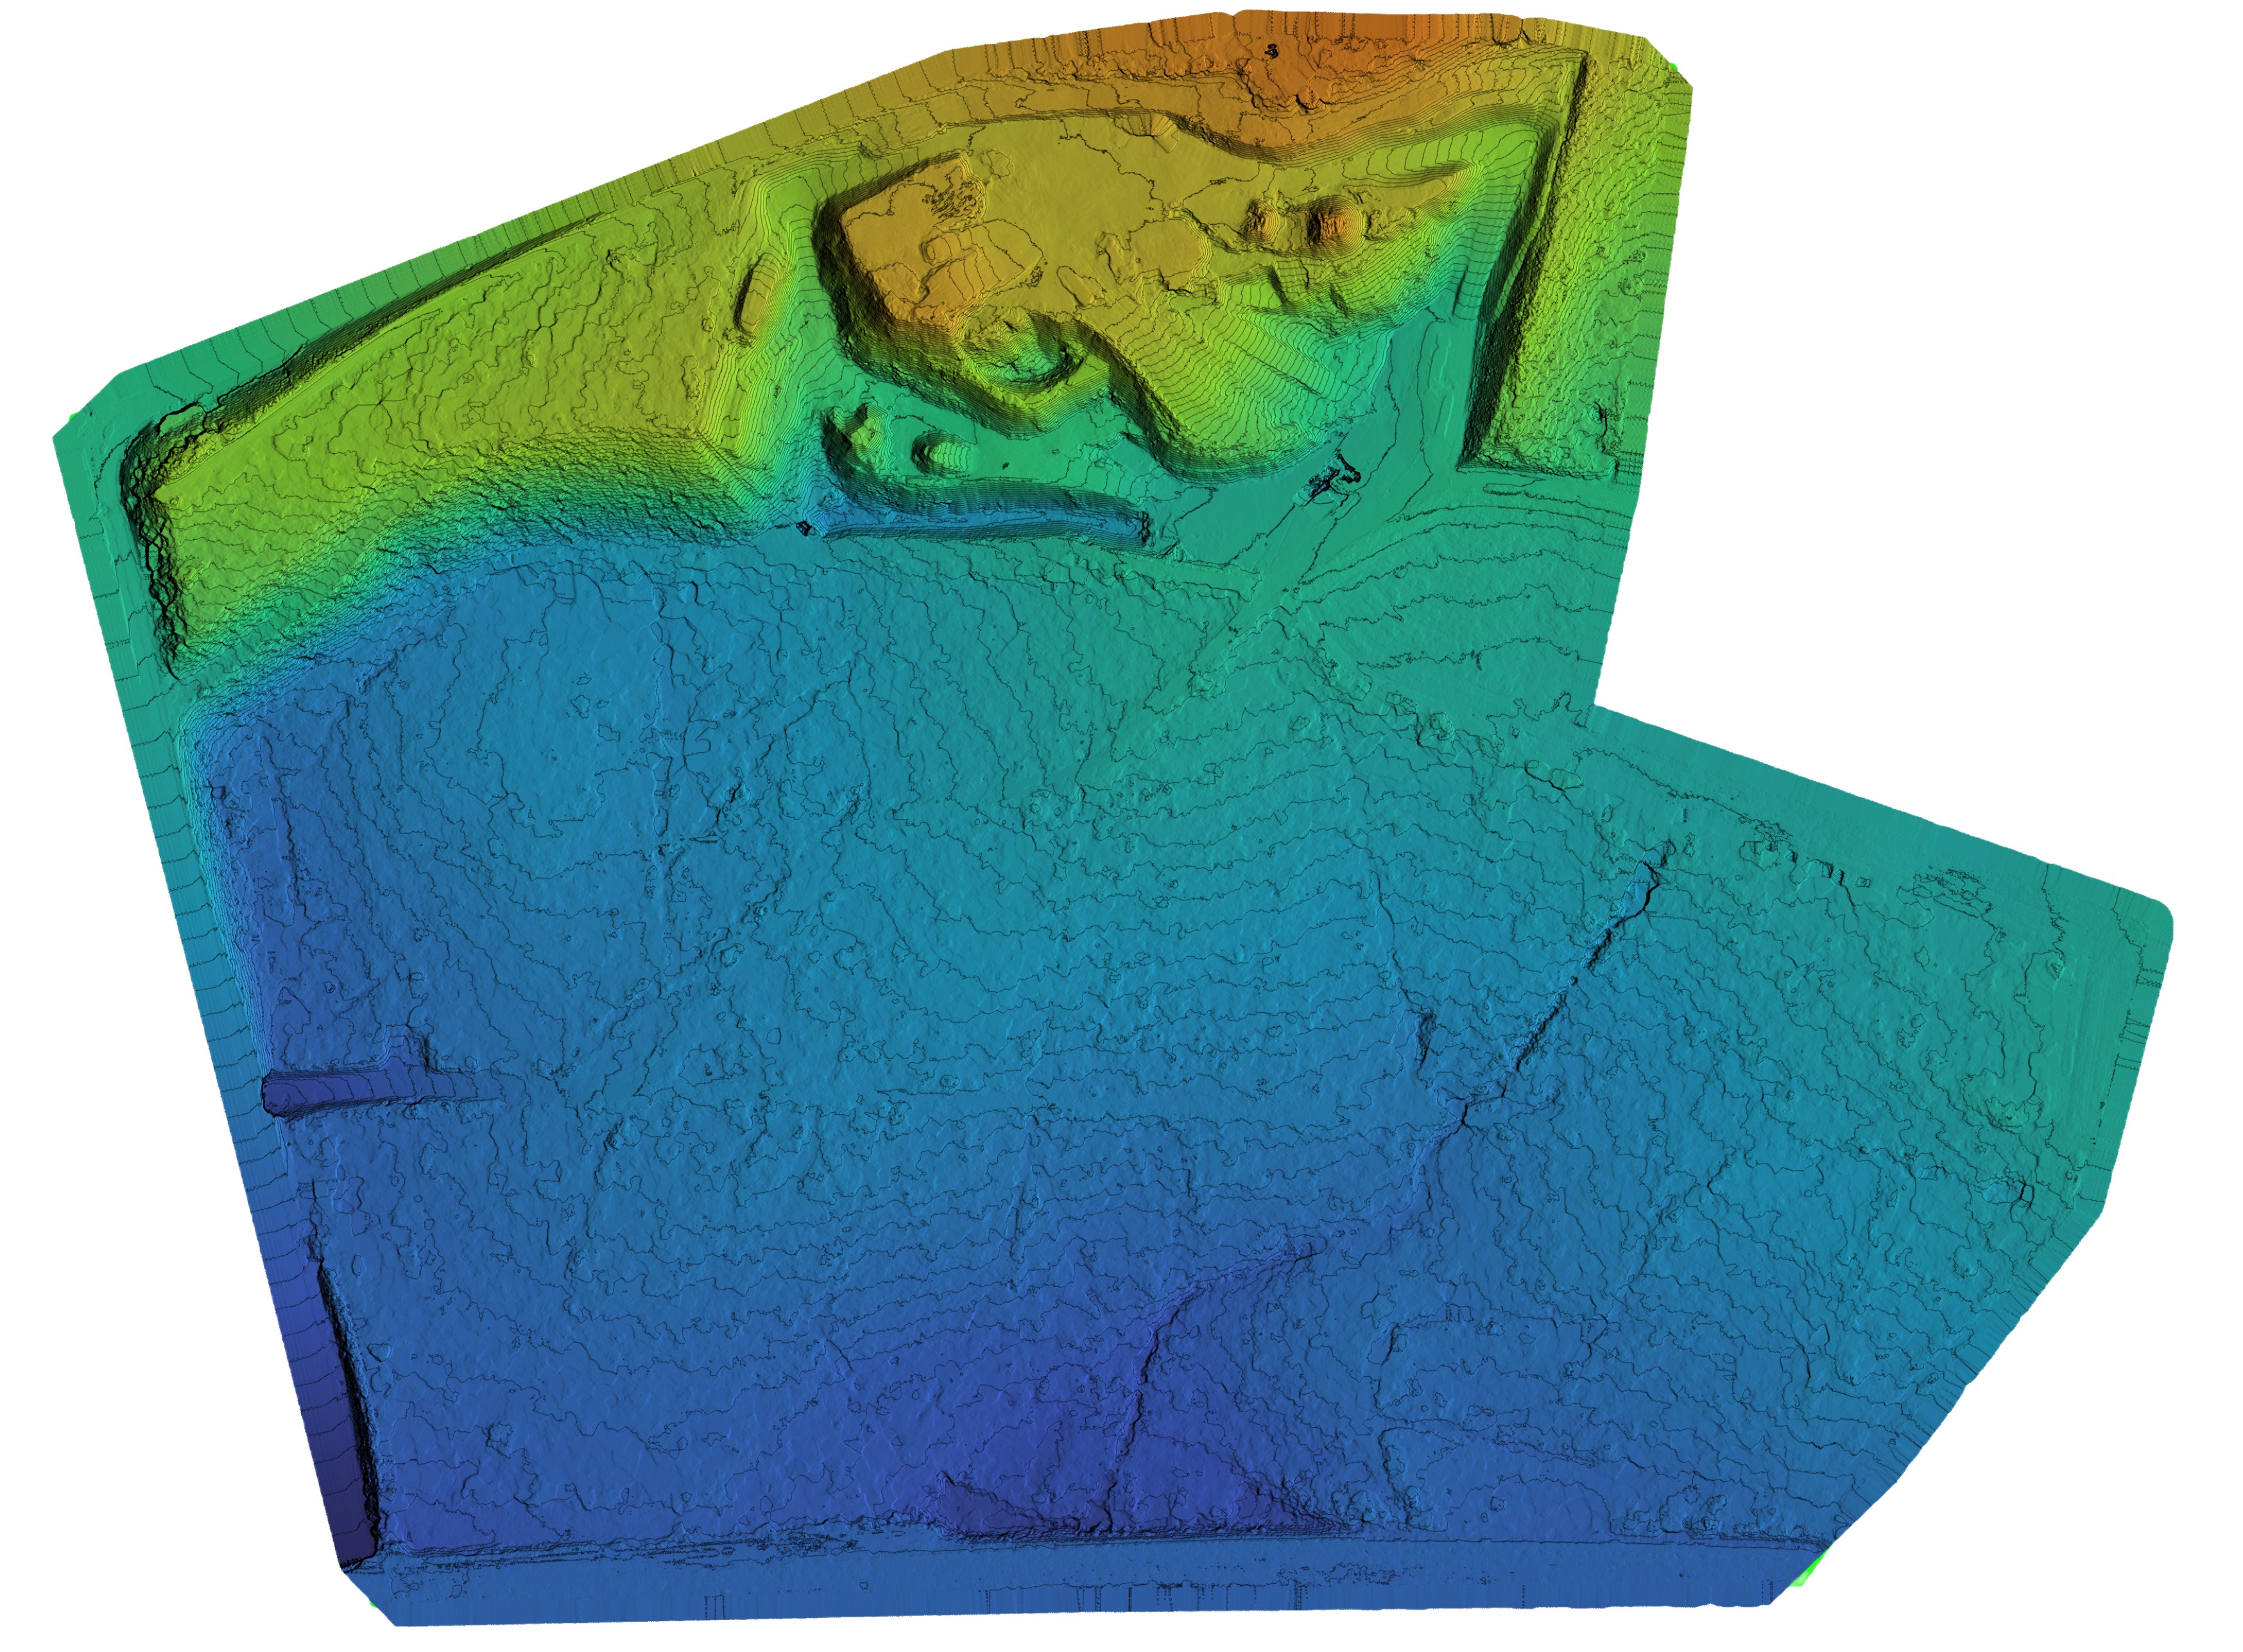
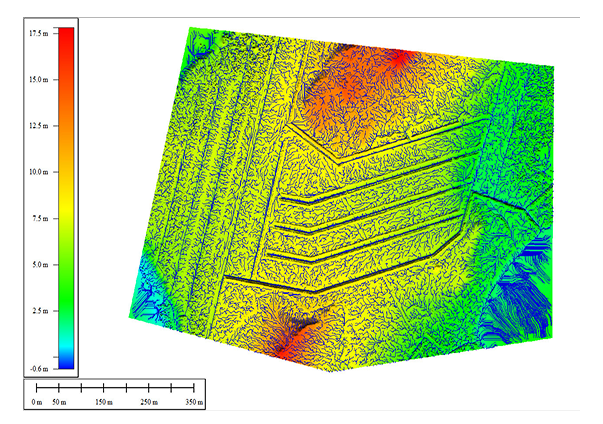
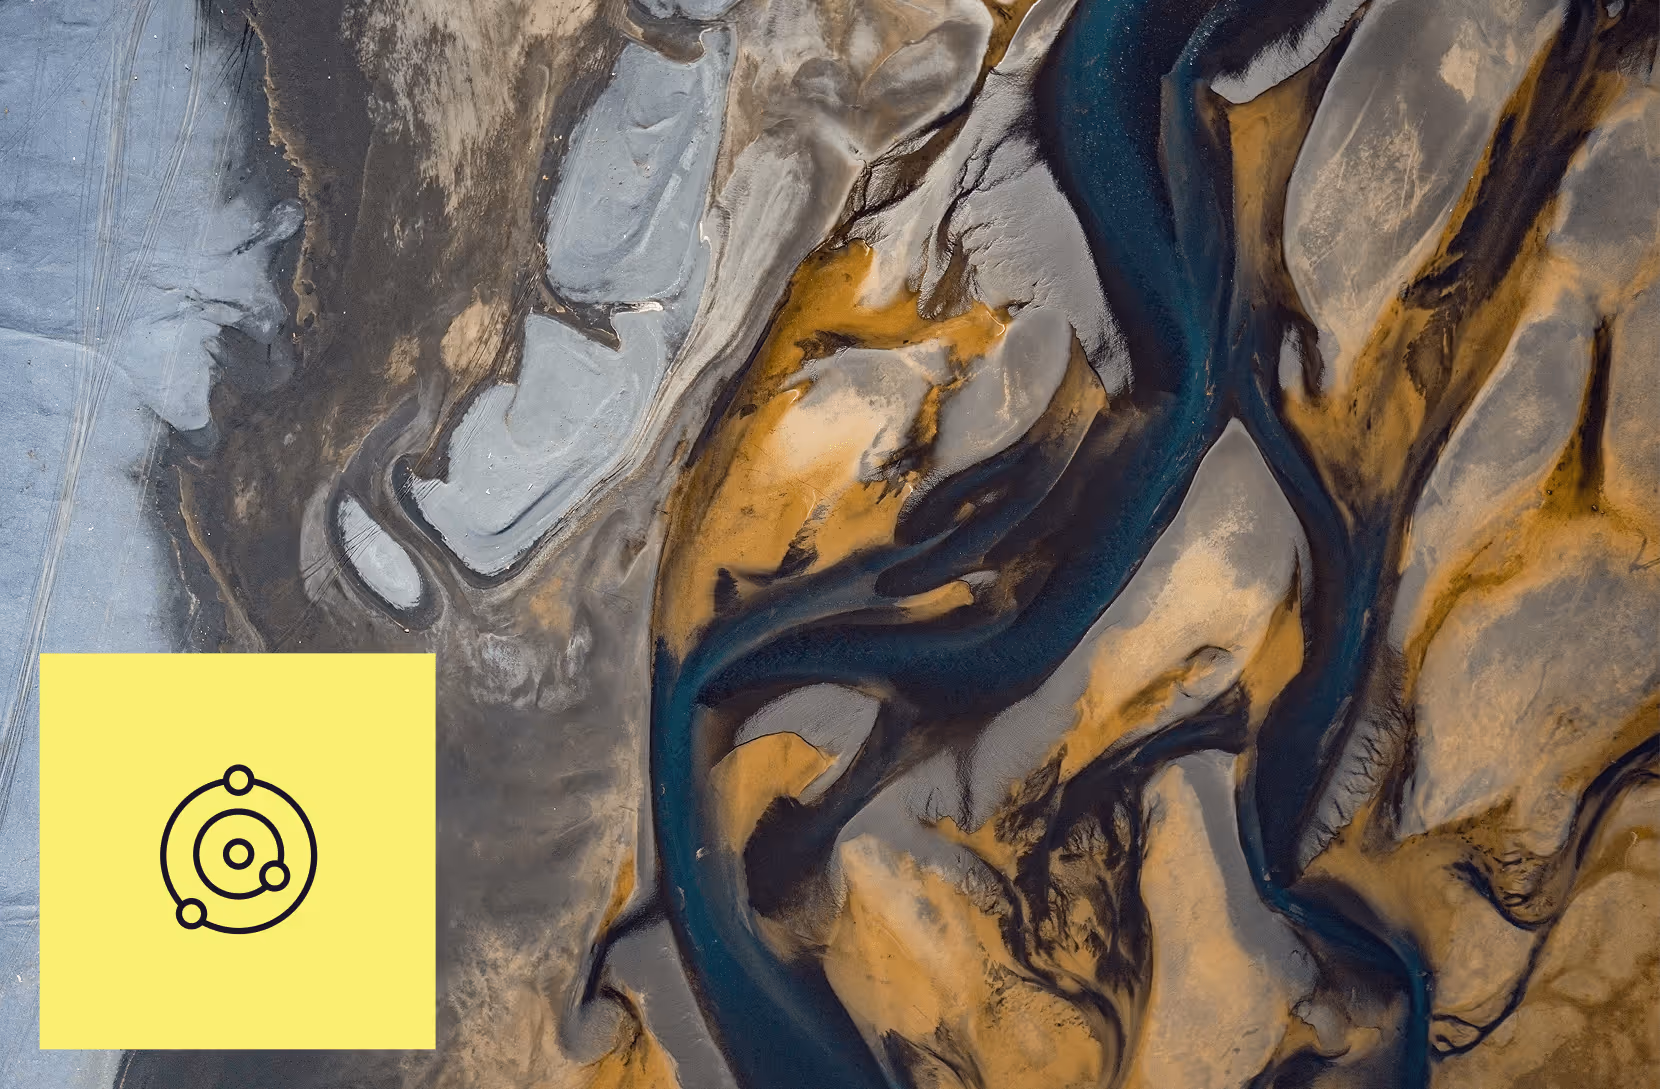
Wetland Restoration and Hydrological Analysis
Our wetland restoration service provides the geospatial foundation needed to plan, implement, and monitor restoration projects with confidence. Using drone and LiDAR data, we map terrain and hydrology in detail — identifying drainage ditches, flow paths, and areas suitable for rewetting. The results help ensure effective restoration design, minimize risk, and verifylong-term outcomes.
Why you need this data
Design restoration with precision – Understand where and how to fill ditches to achieve desired water levels.
Avoid unintended flooding – Model and plan to ensure nearby land, roads, or infrastructure remain unaffected.
Support environmental assessment – Provide verifiable, science-based data for permitting and reporting.
Monitor long-term impact – Compare hydrology, vegetation, and ecosystem development over time.
Optimize resources – Focus restoration efforts where they’ll have the greatest environmental return.
Collaborate effectively – Shared, map-based data helps landowners, ecologists, and authorities work from the same information.

What we Deliver
Detailed terrain mapping – High-resolution digital terrain models (DTMs) reveal subtle elevation differences critical for understanding water flow.
Watershed and flow-path analysis – Identify drainage patterns and catchment boundaries to predict how water will spread after restoration.
Ditch and channel detection – Automatically locate historical drainage ditches that need to be filled or blocked.
Flooding and water retention modeling – Simulate how water levels will respond to restoration measures and estimate inundation areas.
Vegetation mapping and classification – Analyze vegetation types to identify areas suitable for rewetting or sensitive habitats to protect.
Baseline and change monitoring – Document pre- and post-restoration conditions to evaluate success and track ecosystem recovery over time.
GIS and DATACT integration – All outputs are delivered as layers and maps ready for use in DATACT or any GIS platform.
Why choose us?
13+ years of experience in drone mapping, hydrological modeling, and environmental analysis.
High-resolution data from LiDAR and photogrammetry ensures centimeter-level terrain accuracy.
AI-assisted detection for identifying ditches, channels, and vegetation patterns efficiently.
Collaborative workflow – We work with hydrologists, restoration planners, and local experts to ensure results meet project goals.
Comprehensive delivery – From baseline mapping to post-restoration monitoring, all in one place.
Satellite view name goes here
Satellite view name goes here
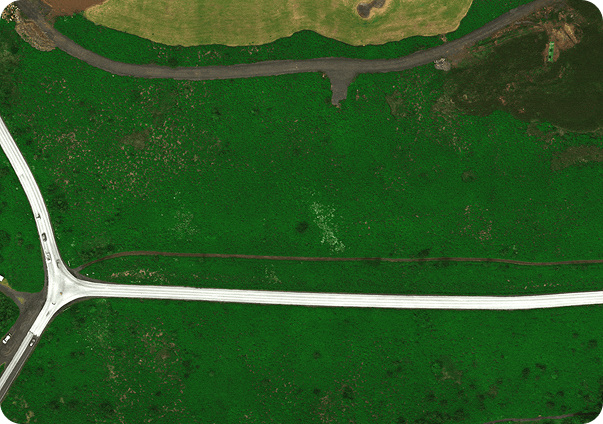
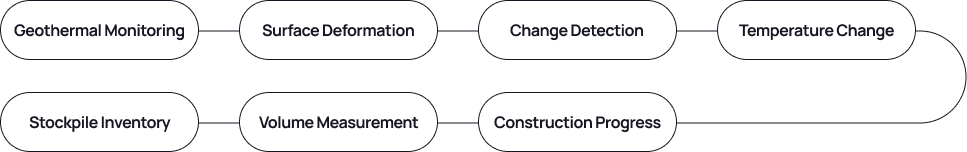
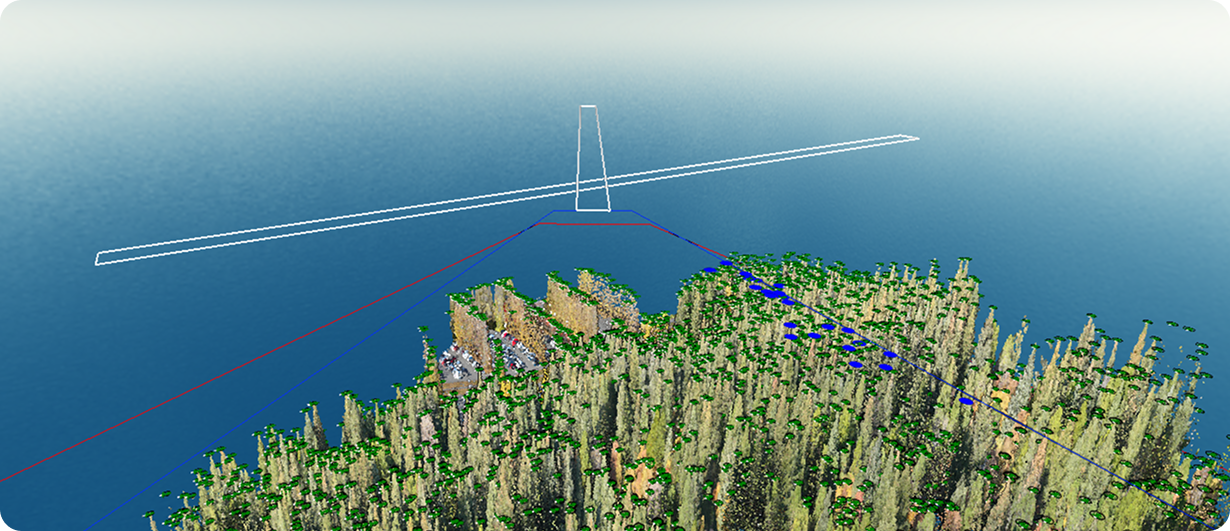
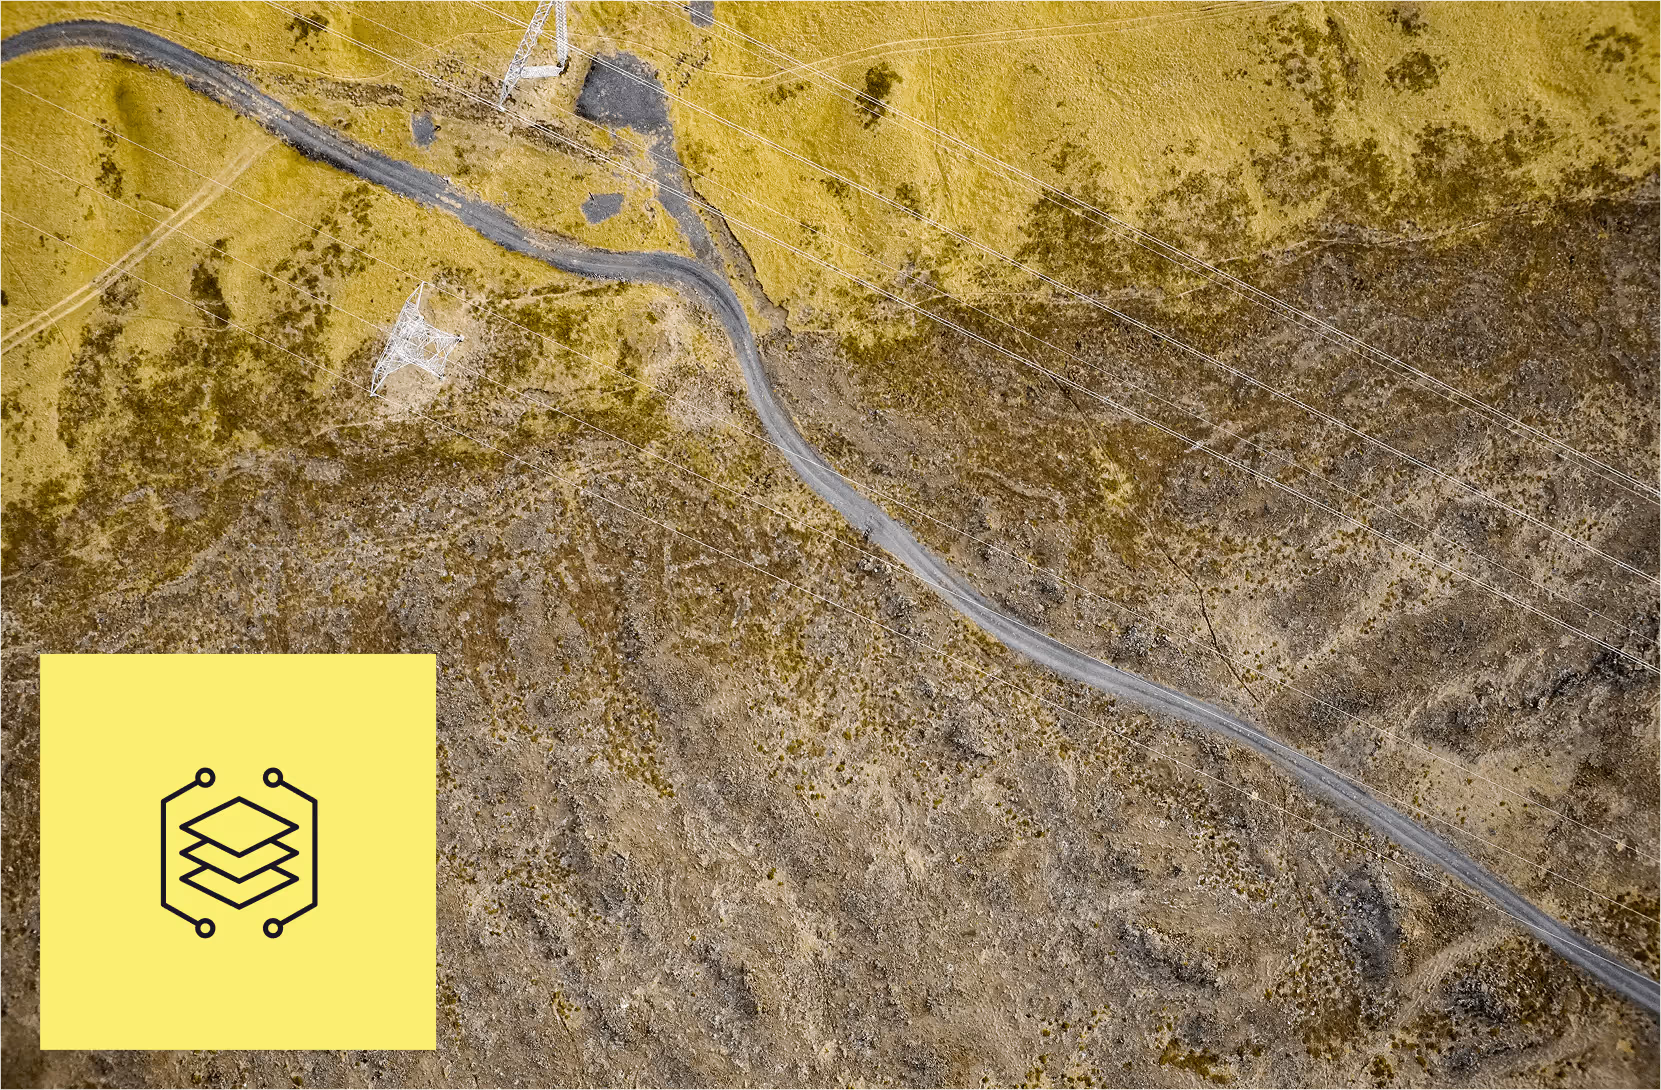
Infrastructure safety and vegetation enroachment
Our vegetation encroachment analysis helps infrastructure operators detect and manage vegetation growth before it becomes a safety or maintenance issue. Using LiDAR, drone imagery, and 3D modeling, we measure vegetation height and distance to assets such as power lines, roads, and runways — providing precise, repeatable insight for risk prevention and compliance.
Why it matters
Prevent service disruptions – Detect risks before they lead to outages, damage, or flight obstructions.
Improve safety – Ensure vegetation remains within regulated clearance zones for critical infrastructure.
Reduce maintenance costs – Plan vegetation management based on accurate growth trends instead of fixed schedules.
Comply with regulations – Meet aviation and utility standards through verifiable geospatial evidence.
Enhance situational awareness – Visualize proximity issues directly on the map for better planning and coordination.
What we deliver
3D vegetation modeling – Generate precise canopy models from LiDAR or photogrammetry to map vegetation height and volume.
Clearance measurement – Quantify the distance between vegetation and critical assets such as power lines, roads, or airport runways.
Growth tracking – Compare datasets over time to detect where vegetation is approaching defined safety thresholds.
Risk zone mapping – Highlight areas where trimming or vegetation control is needed.
Automated alerts – Set up thresholds for proximity violations to simplify monitoring.
Regulatory compliance support – Provide documentation for aviation obstacle clearance or power line safety inspections.
Integration ready – Deliver results as map layers and reports compatible with DATACT or any GIS platform.
Satellite view name goes here
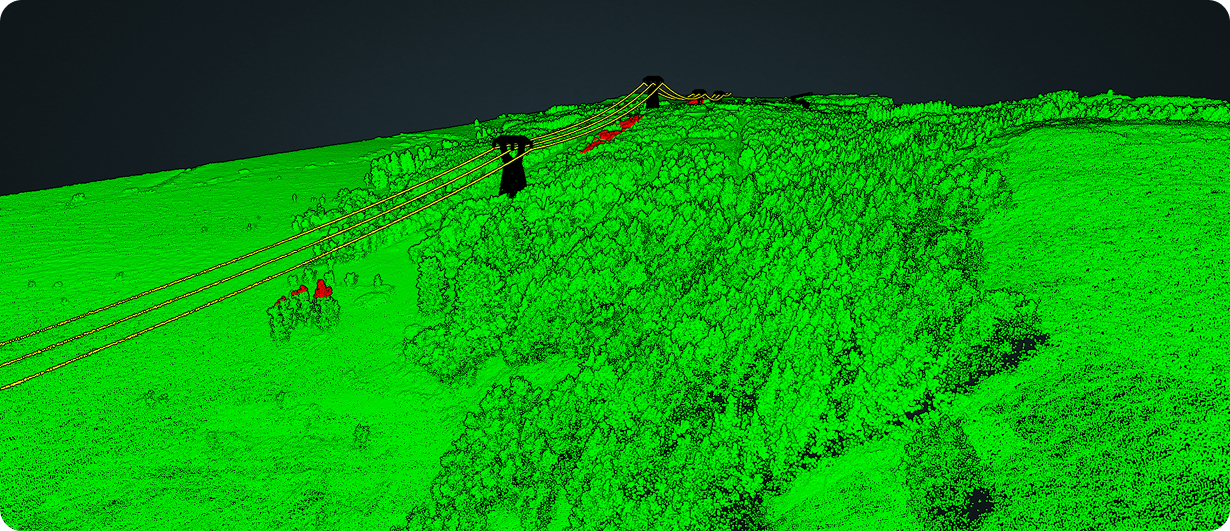
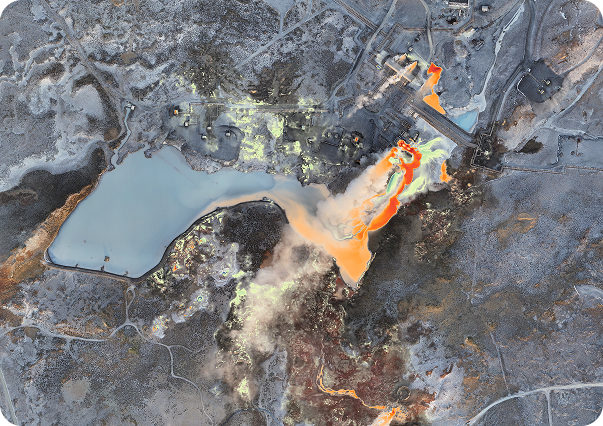
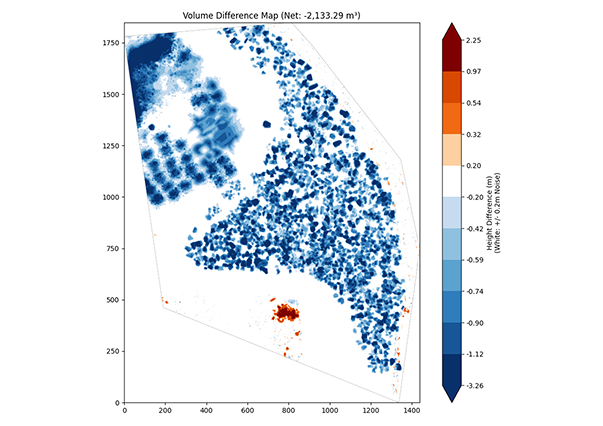
Change Detection and volumetric calculations
Our change detection and volumetric analysis service helps you identify and measure how landscapes, structures, and materials evolve over time. Using repeat drone surveys, thermal mapping, and 3D modeling, we detect changes in terrain, material volume, temperature, or surface condition. The results provide clear, measurable insight for construction management, earthworks, environmental monitoring, and geothermal assessment.
What we deliver
Surface change analysis – Compare visual maps from different time periods to identify areas that have changed, such as land use, erosion, or construction progress.
3D volumetric measurements – Calculate how much material has been excavated, filled, or moved between surveys, ideal for tracking earthworks or stockpiles of gravel, rock, or soil.
Thermal change analysis – Normalize and compare thermal datasets from multiple surveys to detect temperature shifts on the surface — valuable for geothermal areas or heat loss monitoring.
Accurate baselines and references – Every analysis is anchored to precise ground control and 3D models, ensuring consistent, repeatable results.
Visual comparison layers – Highlight changes directly on the map so users can quickly identify where and how conditions have shifted.
DATACT integration – All results are available as interactive map layers within DATACT, or can be exported to any GIS platform.
Why it matters
Track construction and earthworks – Monitor material movement and calculate progress between survey periods.
Assess environmental impact – Detect changes in land cover, vegetation, or surface condition to evaluate project effects.
Support compliance and reporting – Provide accurate, visual evidence of change for environmental monitoring or regulatory documentation.
Optimize resource use – Quantify material stockpiles or excavation volumes to reduce waste andimprove logistics.
Monitor geothermal or thermal variation – Detect surface temperature changes that may indicate geothermal shifts, leaks, or inefficiencies.
Make proactive decisions – Identify issues early by seeing exactly what has changed and where.
Satellite view name goes here
Satellite view name goes here

Our Analysis Philosophy
From Data to Decisions
Our approach is founded on turning complex datasets into clear, confident actions foryour organization.

001
Science-Driven & Technology-Powered
Our methods are rooted in a deep scientific foundation, validated through years of collaboration on international research projects. We leverage this expertise with advanced AI and machine learning tools to deliver analysis that is not just descriptive, but predictive and insightful.
002
Data-Agnostic Expertise
Our experience is vast. We are equally adept at analyzing high-resolution drone LiDAR, multispectral satellite imagery, and publicly available global datasets. We use the best data source for the job, ensuring the most efficient and effective solution.
003
Collaborative Partnership
We function as a seamless extension of your team. We can work independently to deliver turnkey analysis or collaborate closely with your on-site experts and scientists to integrate critical ground-truth data, ensuring our results are perfectly aligned with the realities in the field.
004
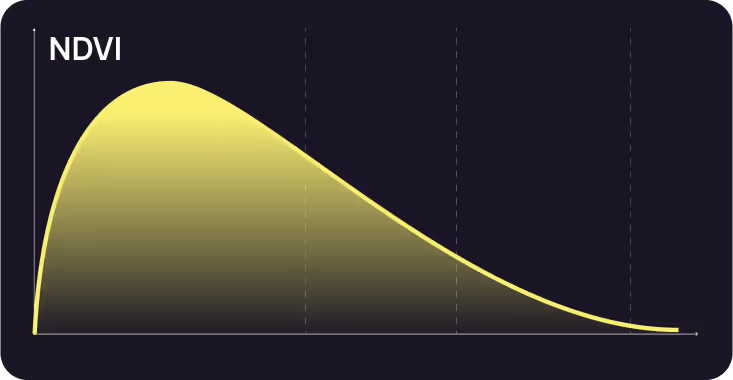
Revealing the Unseen
Remote sensing data tells a story that can be missed on the ground. By analyzing frequent data captures over time, we can spot subtle, yet critical, trends that are invisible to the naked eye. We have seen this first-hand where a simple NDVI graph revealed a drop in vegetation health due to a short-term drought that on-site experts had not noticed. This ability to see thebigger picture allows for proactive, rather than reactive, management.
Flexible
Engagement Models
We tailor our engagement to fit your exact needs and internal capabilities.
001
Analysis as a Service: You provide the data, and we provide the insights. This is ideal for clients who have data but lack the specialized tools or expertise for advanced analysis.
002
End-to-End Project Partnership: We manage the entire project lifecycle, from strategic data collection planning and field acquisition (drone, satellite, and ground-truth) to final . analysis and reporting.
003
Embedded Research & Development: We join your project team or consortium, acting as the dedicated geospatial analysis and R&D partner, pioneering new methods to solve unique challenges.
Unsere wissenschaftliche Grundlage und globale Erfahrung
Unsere Projekterfahrung erstreckt sich über die ganze Welt, mit erfolgreichen Lieferungen auf allen Kontinenten außer der Antarktis. Eine Vielzahl von Kunden vertraut uns, von kleinen, agilen Teams von 2 bis 5 Personen bis hin zu einigen der größten und angesehensten Unternehmen der Welt.
Unsere Glaubwürdigkeit basiert auf einer starken Grundlage wissenschaftlicher Forschung und globaler Projektdurchführung. Wir haben an zahlreichen europäischen Forschungsprojekten teilgenommen, von denen einige von der EU finanziert wurden und die kritische Umweltprozesse untersuchten. Diese Arbeit, die oft in Zusammenarbeit mit lokalen Experten wie den nationalen Forstbehörden durchgeführt wird, ermöglicht es uns, unsere Methoden kontinuierlich zu validieren und zu verfeinern, um sicherzustellen, dass wir in der Geowissenschaft an der Spitze bleiben.
Research & Publications
We believe in contributing to the scientific community.
Our team has been a part of numerous studies and publications.

Analytische Kernkompetenzen
Wir bieten eine umfassende Palette analytischer Dienstleistungen, die auf die spezifischen Bedürfnisse von Infrastruktur-, Umwelt- und Rohstoffprojekten zugeschnitten sind.
Integrität der Infrastruktur und Vermögensverwaltung
Wir verwenden Point Cloud- und Bildanalysen, um die Sicherheit, die Einhaltung der Vorschriften und den Fortschritt kritischer Infrastrukturen zu überwachen.
- Analyse von Vegetationseingriffen: Automatische Erkennung von Vegetation, die sich Infrastrukturen wie Stromleitungen, Pipelines, Eisenbahnen und Landebahnen von Flughäfen nähert oder diese verletzt.
- Überwachung von Bau- und Erdarbeiten: Präzise Volumenberechnungen, Cut-and-Fill-Analysen und Fortschrittsverfolgung für Baustellen und Steinbrüche.
- Erkennung von Infrastrukturänderungen: Hochpräzise Überwachung von Staudämmen, Brücken und anderen kritischen Bauwerken zur Erkennung von Verformungen, Absenkungen oder Veränderungen im Laufe der Zeit.
- Analyse der Hangstabilität und der Geogefährdung: DTM- und Point Cloud-Analyse zur Identifizierung von Gebieten, in denen das Risiko von Erdrutschen oder Erosion besteht.
Von den Daten zur Entscheidung — Die Macht der Analyse:
- Vorher: Sie haben eine riesige 3D-Point Cloud eines Stromleitungskorridors — Milliarden von Punkten, die nicht manuell interpretiert werden können.
- Nach: Wir liefern einen genauen Bericht, in dem die genaue Position von 15 bestimmten Bäumen aufgeführt ist, die eine direkte Bedrohung für die Stromleitungen darstellen, sodass Sie Wartungsteams effizient entsenden und Ausfälle verhindern können.

Umwelt- und Ökosystemanalyse
Wir sind spezialisiert auf detaillierte Analysen natürlicher Umgebungen für UVP-, Monitoring- und Nature-Based Solution-Projekte.
- Fortgeschrittene Waldinventare: Neben einfachen Kennzahlen liefern wir detaillierte Berichte über Baumhöhe, Baumkronendichte, Baumkronenbedeckung, Schätzung der Waldbiomasse, Berechnung des Kohlenstoffbestands und Analyse von Waldlücken.
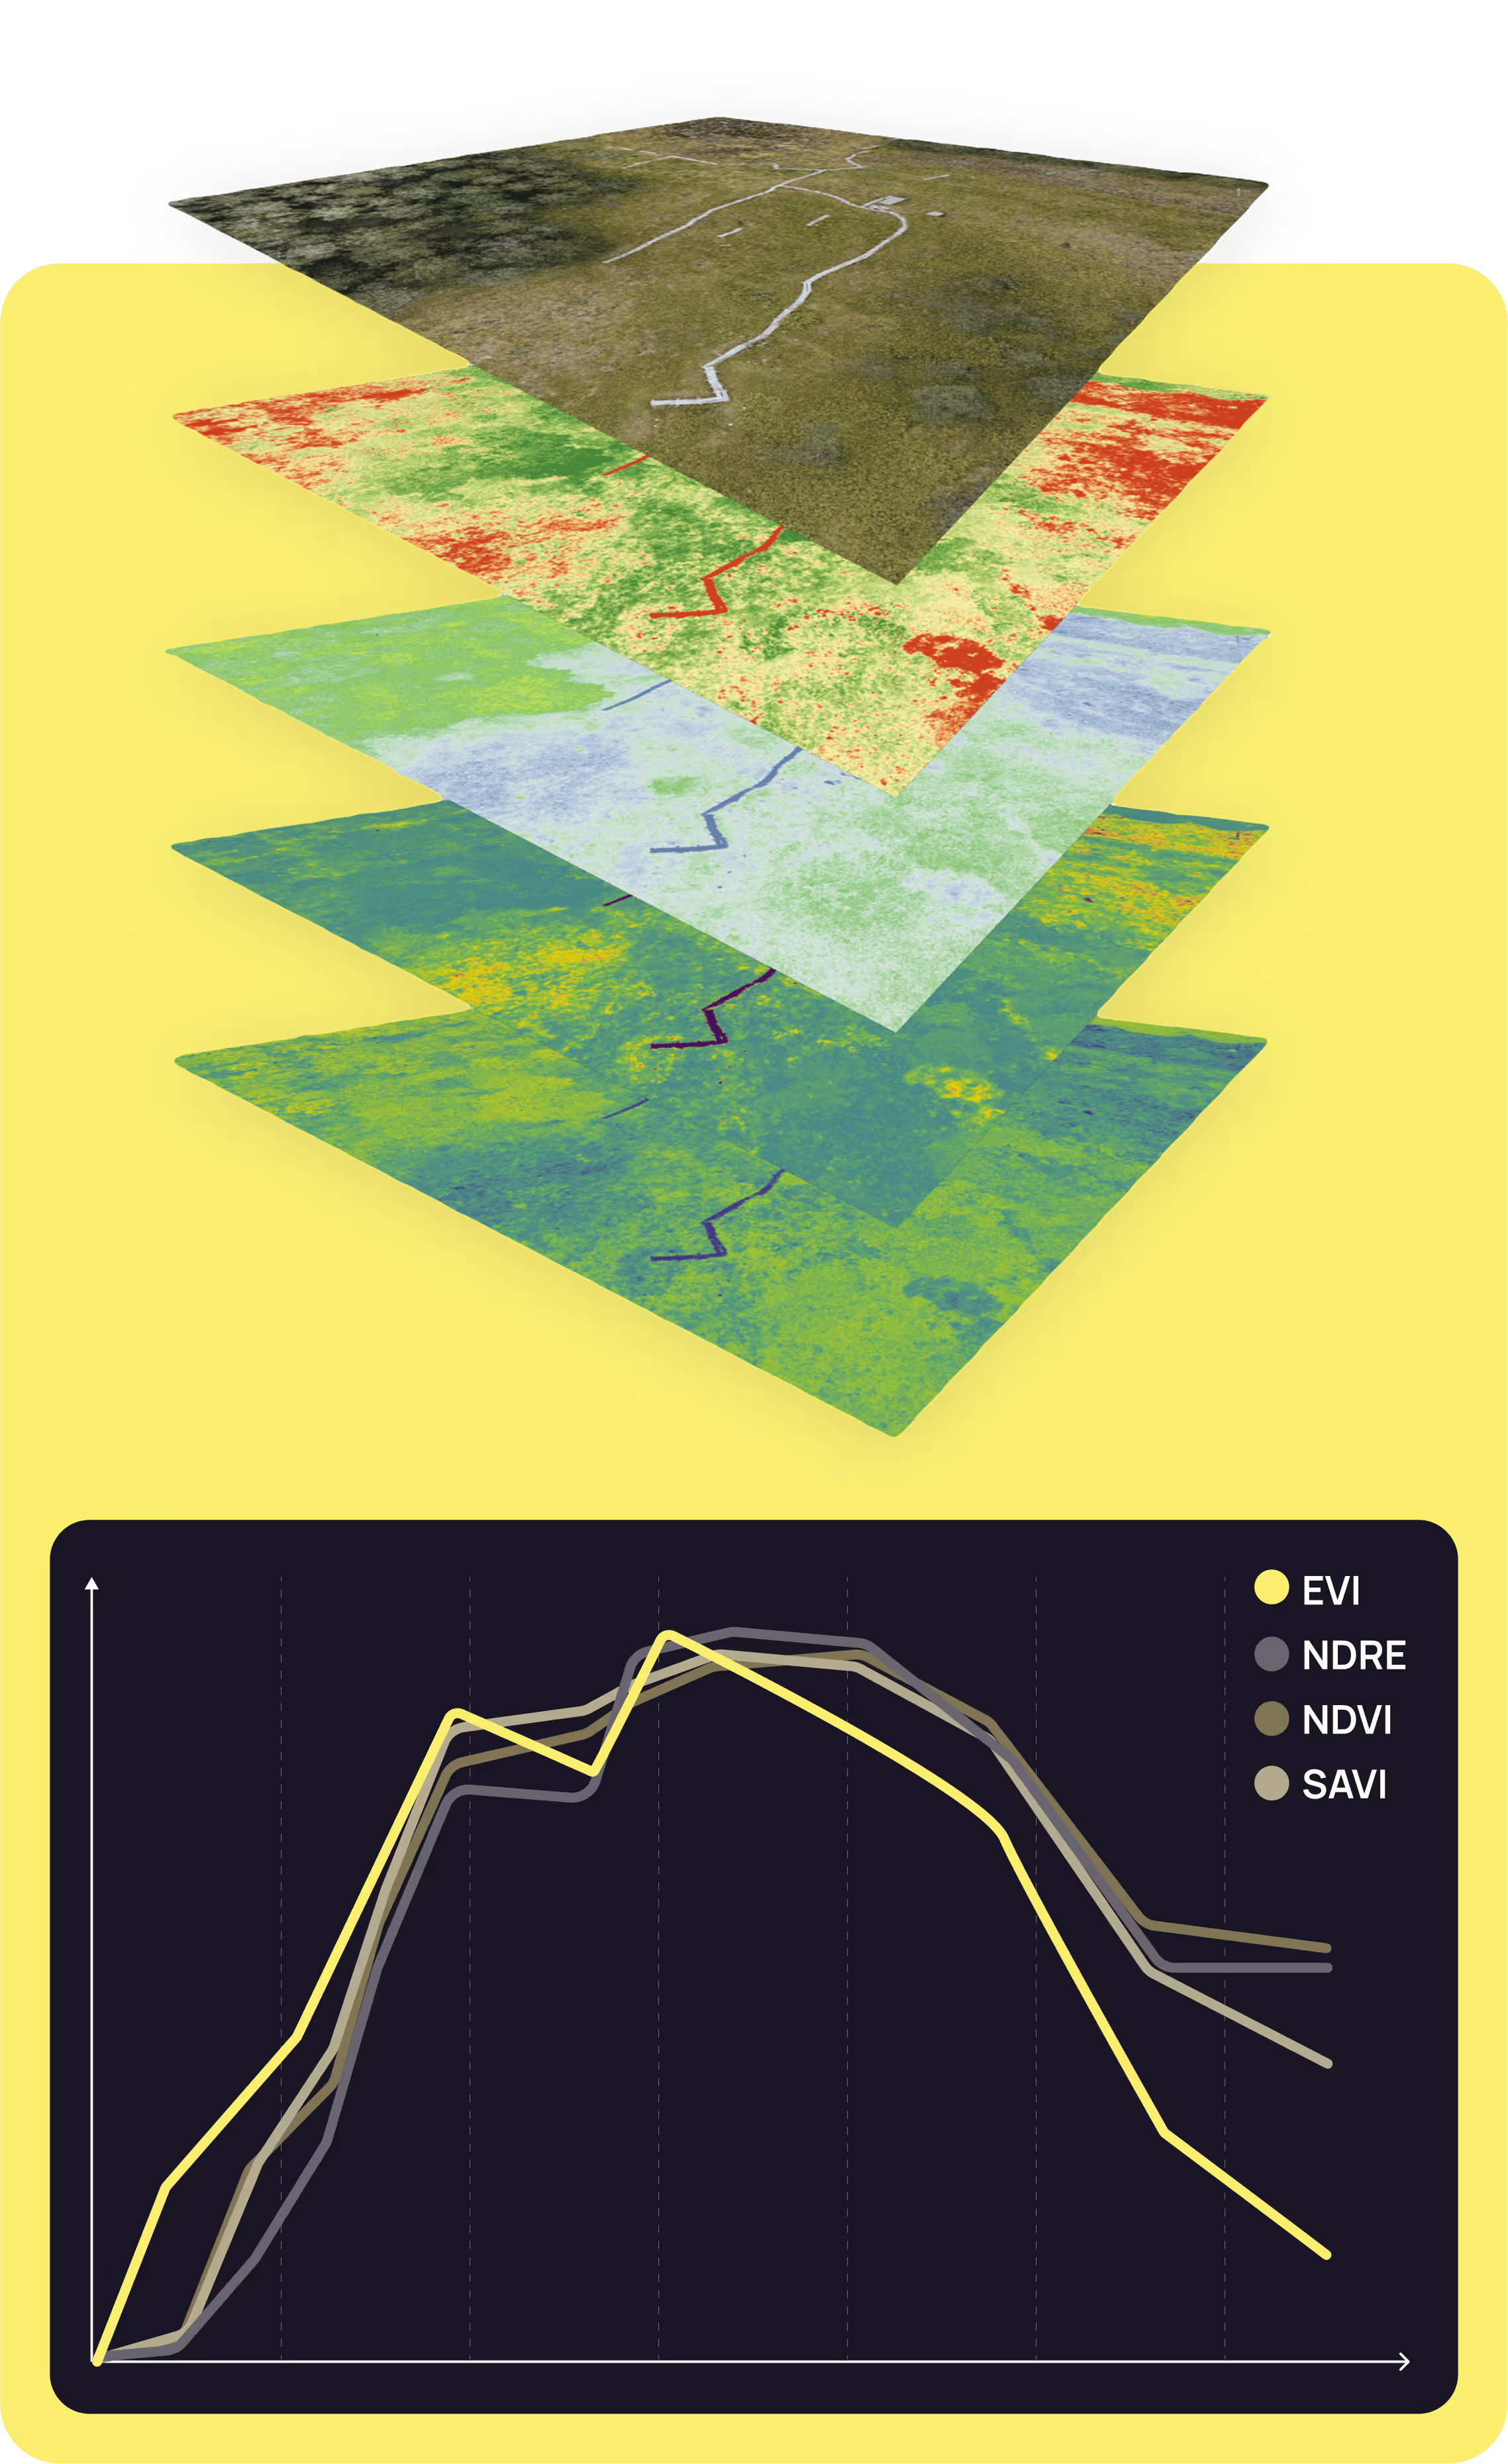
- Vegetationsgesundheit und Artenklassifizierung: Verwendung multispektraler und hyperspektraler Daten zur Bewertung der Vegetationsgesundheit (NDVI und andere Indizes) und zur KI-gestützten Klassifizierung von Pflanzenarten und zur Kartierung invasiver Arten.
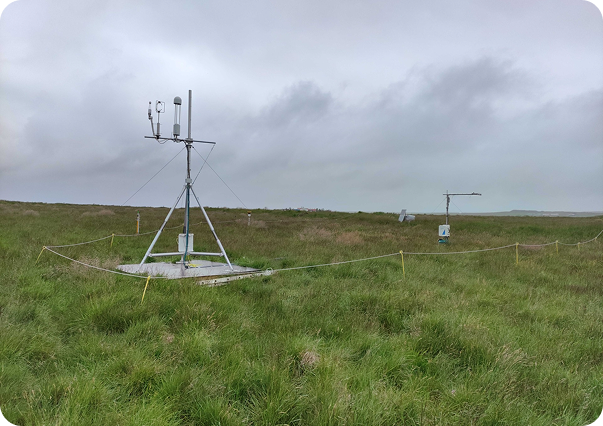
- Feuchtgebiete- und hydrologische Analyse: Kartierung von Feuchtgebietsgrenzen, Überwachung von Veränderungen des Wasserspiegels und Analyse der Kohlenstoffkreisläufe in wiederhergestellten Ökosystemen.
- Kartierung der Habitateignung: Kombination verschiedener Datenebenen zur Modellierung und Identifizierung idealer Lebensräume für bestimmte Wildtierarten.
Von den Daten zur Entscheidung — Die Macht der Analyse:
- Vorher: Sie haben ein hochauflösendes Luftbild eines 1.000 Hektar großen Naturschutzgebiets. Eine bestimmte invasive Pflanzenart manuell zu zählen, um ihre Ausbreitung zu beurteilen, würde monatelange, mühsame Arbeit erfordern.
- Nach: Unser KI-Modell analysiert das gesamte Bild innerhalb von Stunden und liefert ein klares Ergebnis: geschätzte 1,2 Millionen Exemplare der invasiven Pflanze, wobei eine Heatmap die dichtesten Konzentrationen zeigt. Auf diese Weise können Sie die Ausrottungsmaßnahmen gezielt dort einsetzen, wo sie die größte Wirkung haben.
Erweiterte Klassifizierung und Änderungserkennung
Wir nutzen KI und maschinelles Lernen, um groß angelegte Analysen durchzuführen und Trends aufzudecken.
- Klassifizierung von Landnutzung/Landbedeckung (LULC): Hochgenaue, automatisierte Kartierung von Landbedeckungstypen für die Umweltüberwachung und -planung.
- Automatisierte Feature-Extraktion: KI-gestützte Erkennung und Zählung bestimmter Objekte, von einzelnen Bäumen und landwirtschaftlichen Anlagen bis hin zu Infrastrukturkomponenten.
- Langfristige Erkennung von Veränderungen: Zeitreihenanalyse unter Verwendung historischer Satelliten- und Luftdaten zur Quantifizierung von Umwelt- oder Landnutzungsänderungen über Jahre oder Jahrzehnte.
Von den Daten zur Entscheidung — Die Macht der Analyse:
- Vorher: Sie haben Satellitenbilder aus 20 Jahren für eine Region, aber es ist schwierig, das Muster des Wandels zu verstehen.
- Nach: Wir liefern einen klaren, präzisen Bericht, aus dem hervorgeht, dass die Region 15% ihrer Feuchtgebietsfläche durch die Ausweitung der Landwirtschaft verloren hat, sodass Sie datengestützte politische Empfehlungen aussprechen können.
Starten Sie
mit Svarmi
Get tailored advice and find out how
our analysis can support your goals.
