Geospatial Modeling and Environmental Insight
Turning spatial Data into meaningful insights
Our geospatial analysis services integrate drone, satellite, LiDAR, and ground-based data into unified, meaningful insights.
Through a combination of scientific methods and AI-powered analytics, we deliver results that are both reliable and scalable — from vegetation and land-cover classification to carbon estimation, change detection, and environmental monitoring.
With more than 13 years of experience in remote sensing and geospatial science, we provide the clarity and context needed for sustainable planning, infrastructure development, and natural resource management.
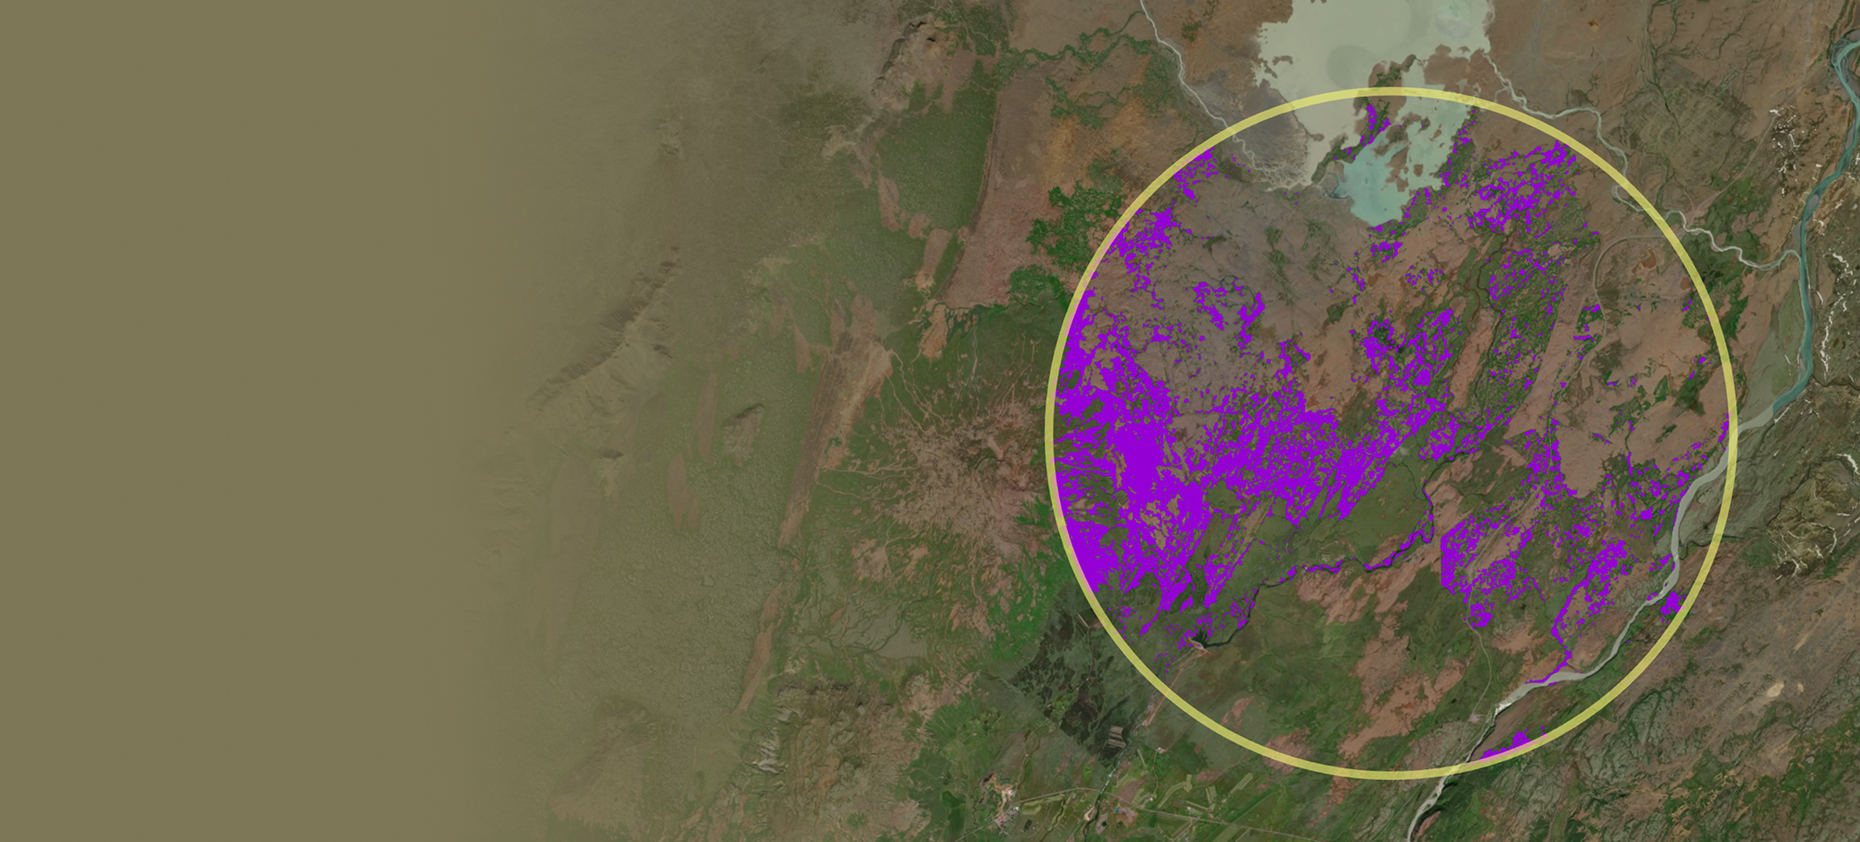
32%
TOTAL INVASIVE SPECIES COVERAGE
Forest Inventory
Our forest inventory service provides accurate and detailed information about forests using drone and LiDAR data. We identify and classify individual trees, measure their height above ground, analyze forest density and health, and generate detailed terrain and canopy models. The result is a complete overview of the forest structure and condition — supporting better planning, management, and environmental decision-making.
What we Deliver
Tree detection and classification – Identify and classify individual trees using fused LiDAR, RGB, multispectral, and hyperspectral data.
Tree height measurement – Calculate minimum, maximum, and average tree heights relative to the ground surface.
Forest density and structure mapping – Visualize tree distribution and canopy coverage to understand forest composition and growth patterns.
Forest health analysis – Detect variations in canopy condition and identify signs of stress or change over time.
Carbon estimation – Use LiDAR-derived structure and regression models to estimate above-ground biomass and carbon storage.
Key Benefits
Save time and resources compared to traditional field inventories.
Access detailed, repeatable forest metrics for planning, management, and reporting.
Monitor forest health and biomass to support sustainability and carbon tracking goals.
Enhance terrain understanding for infrastructure and land-use planning.
Receive ready-to-use GIS-compatible data for decision-making and integration with other systems.
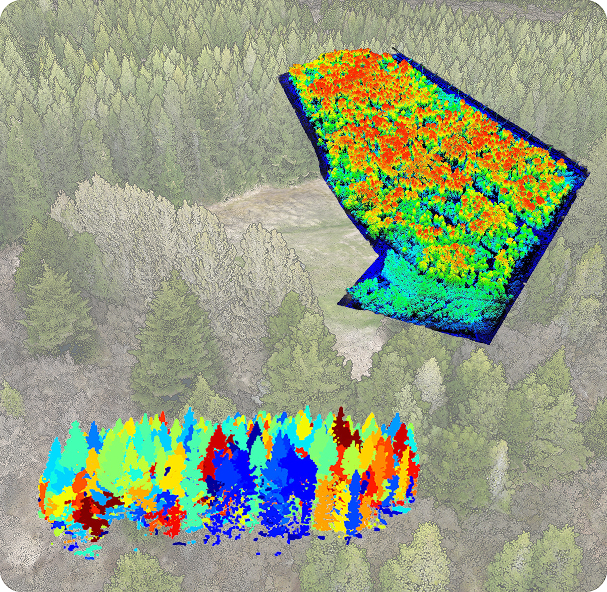
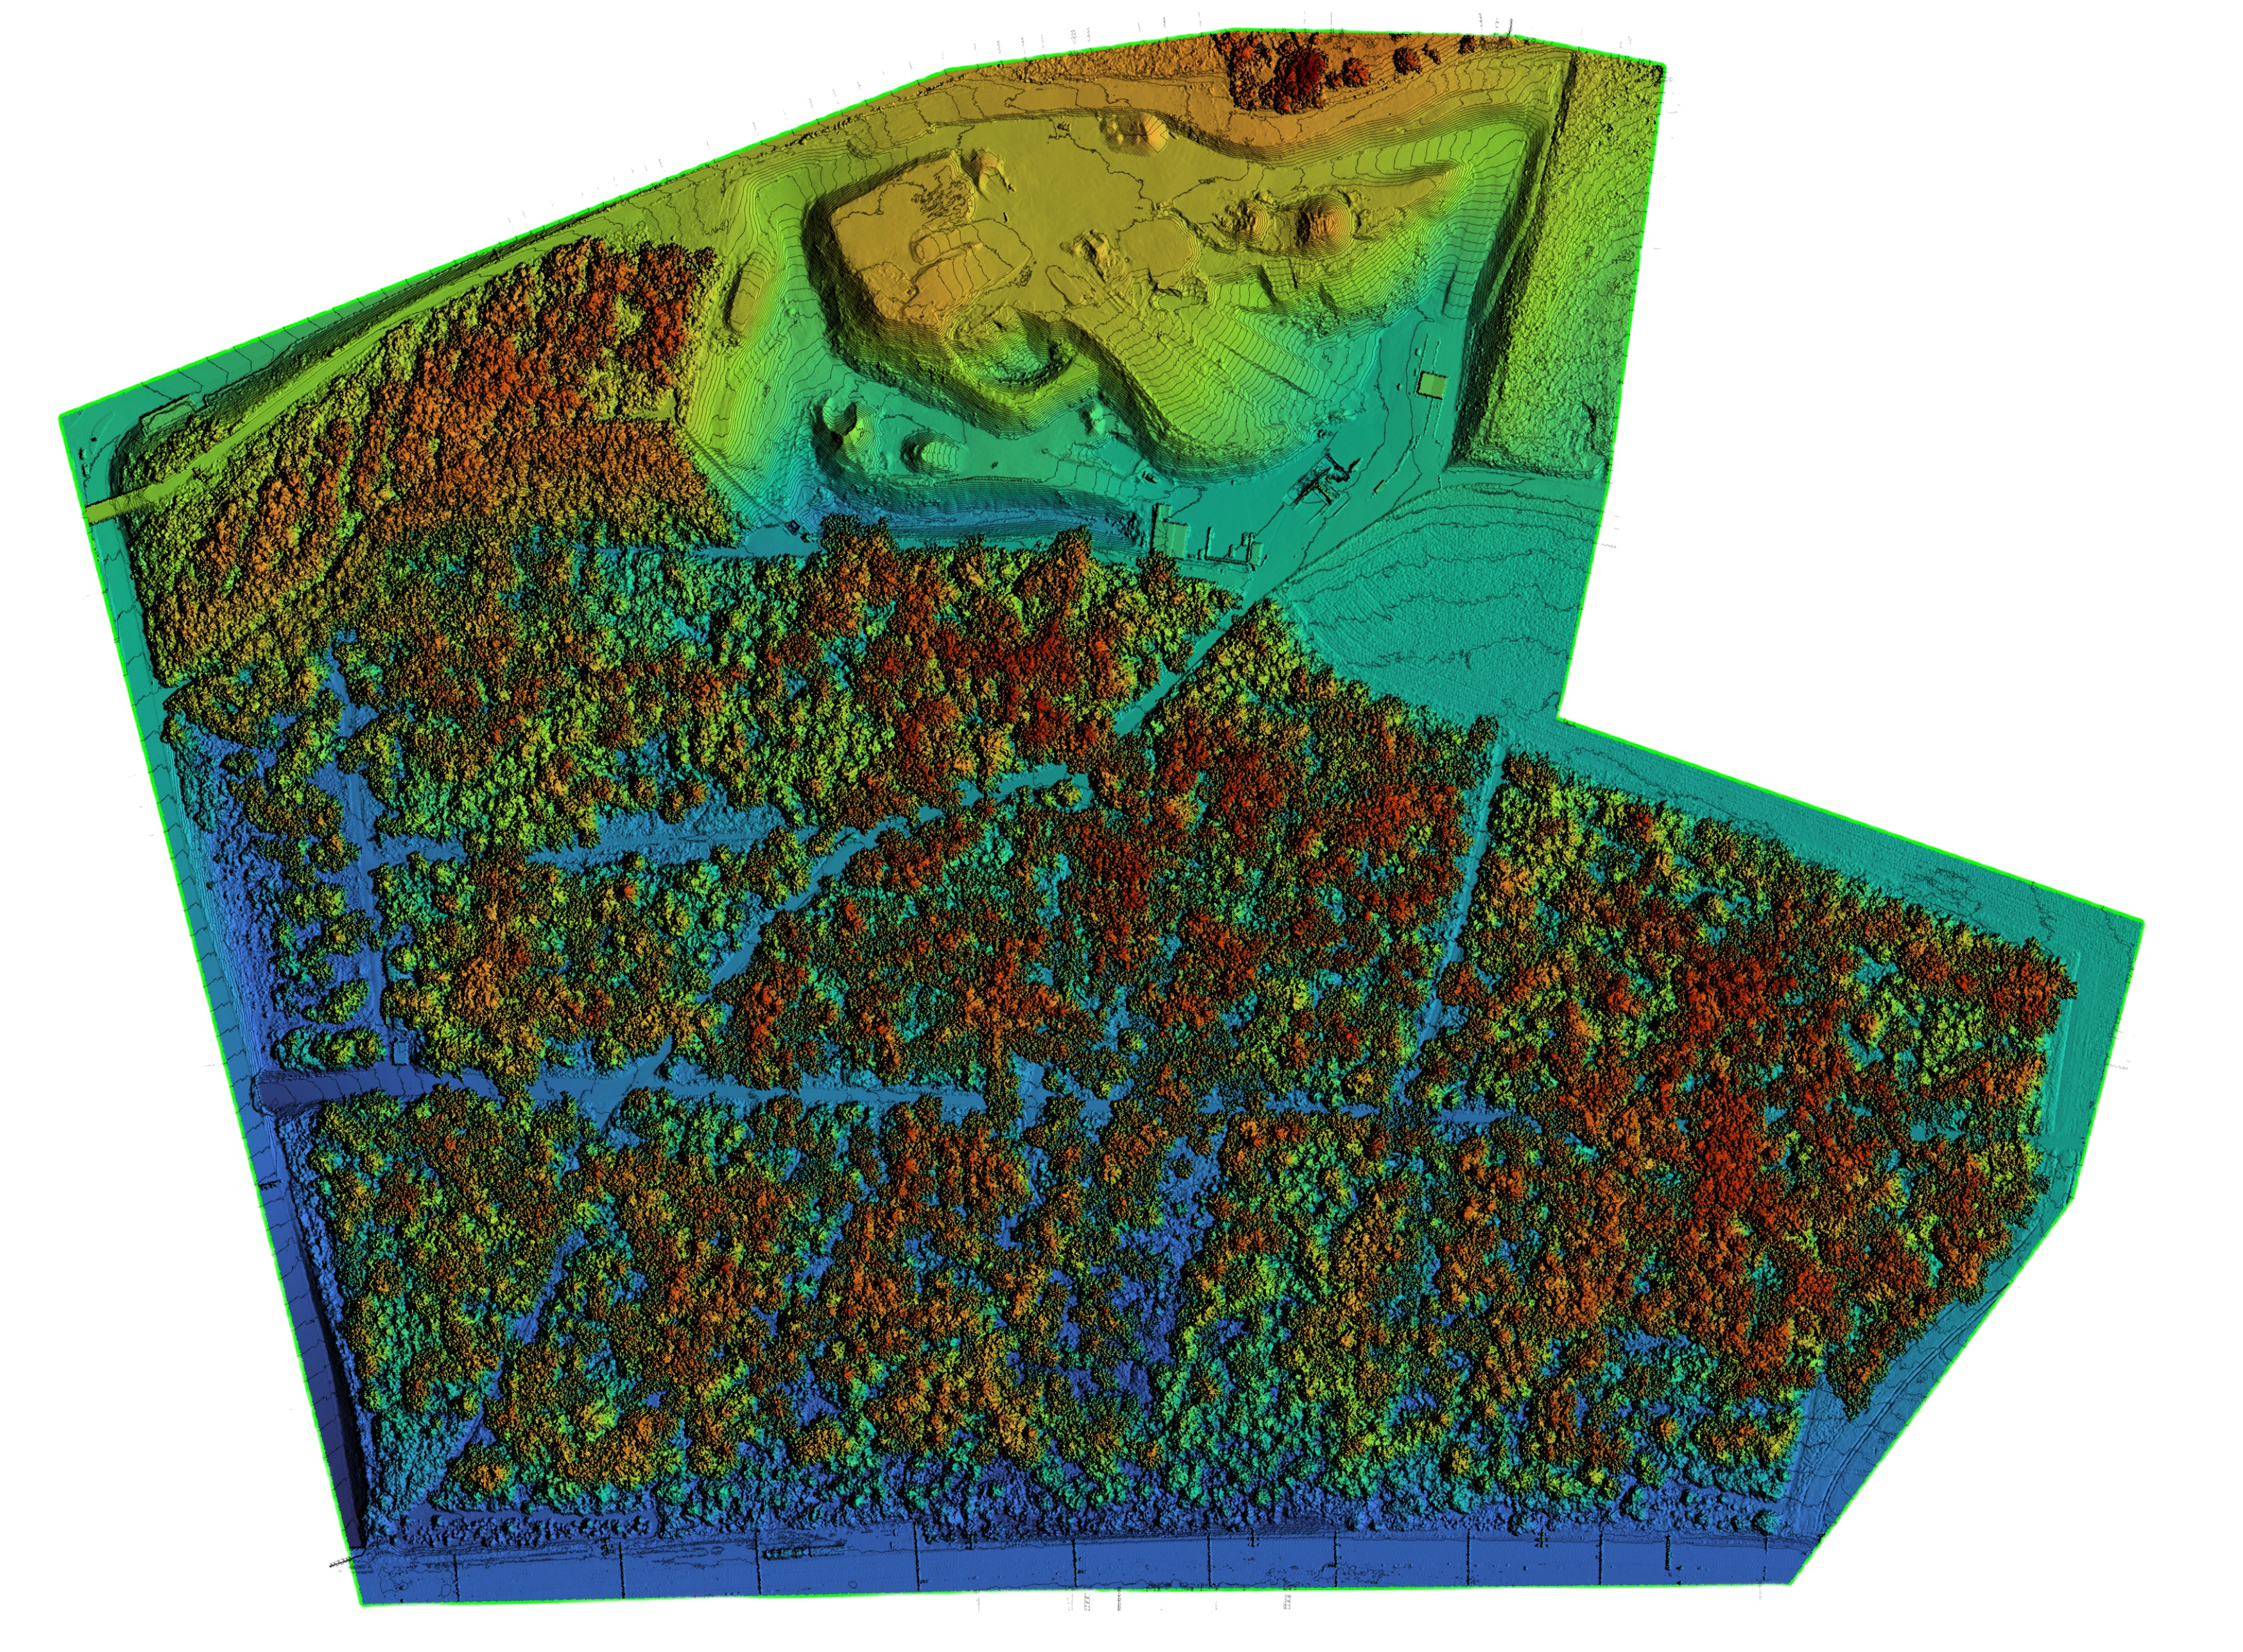
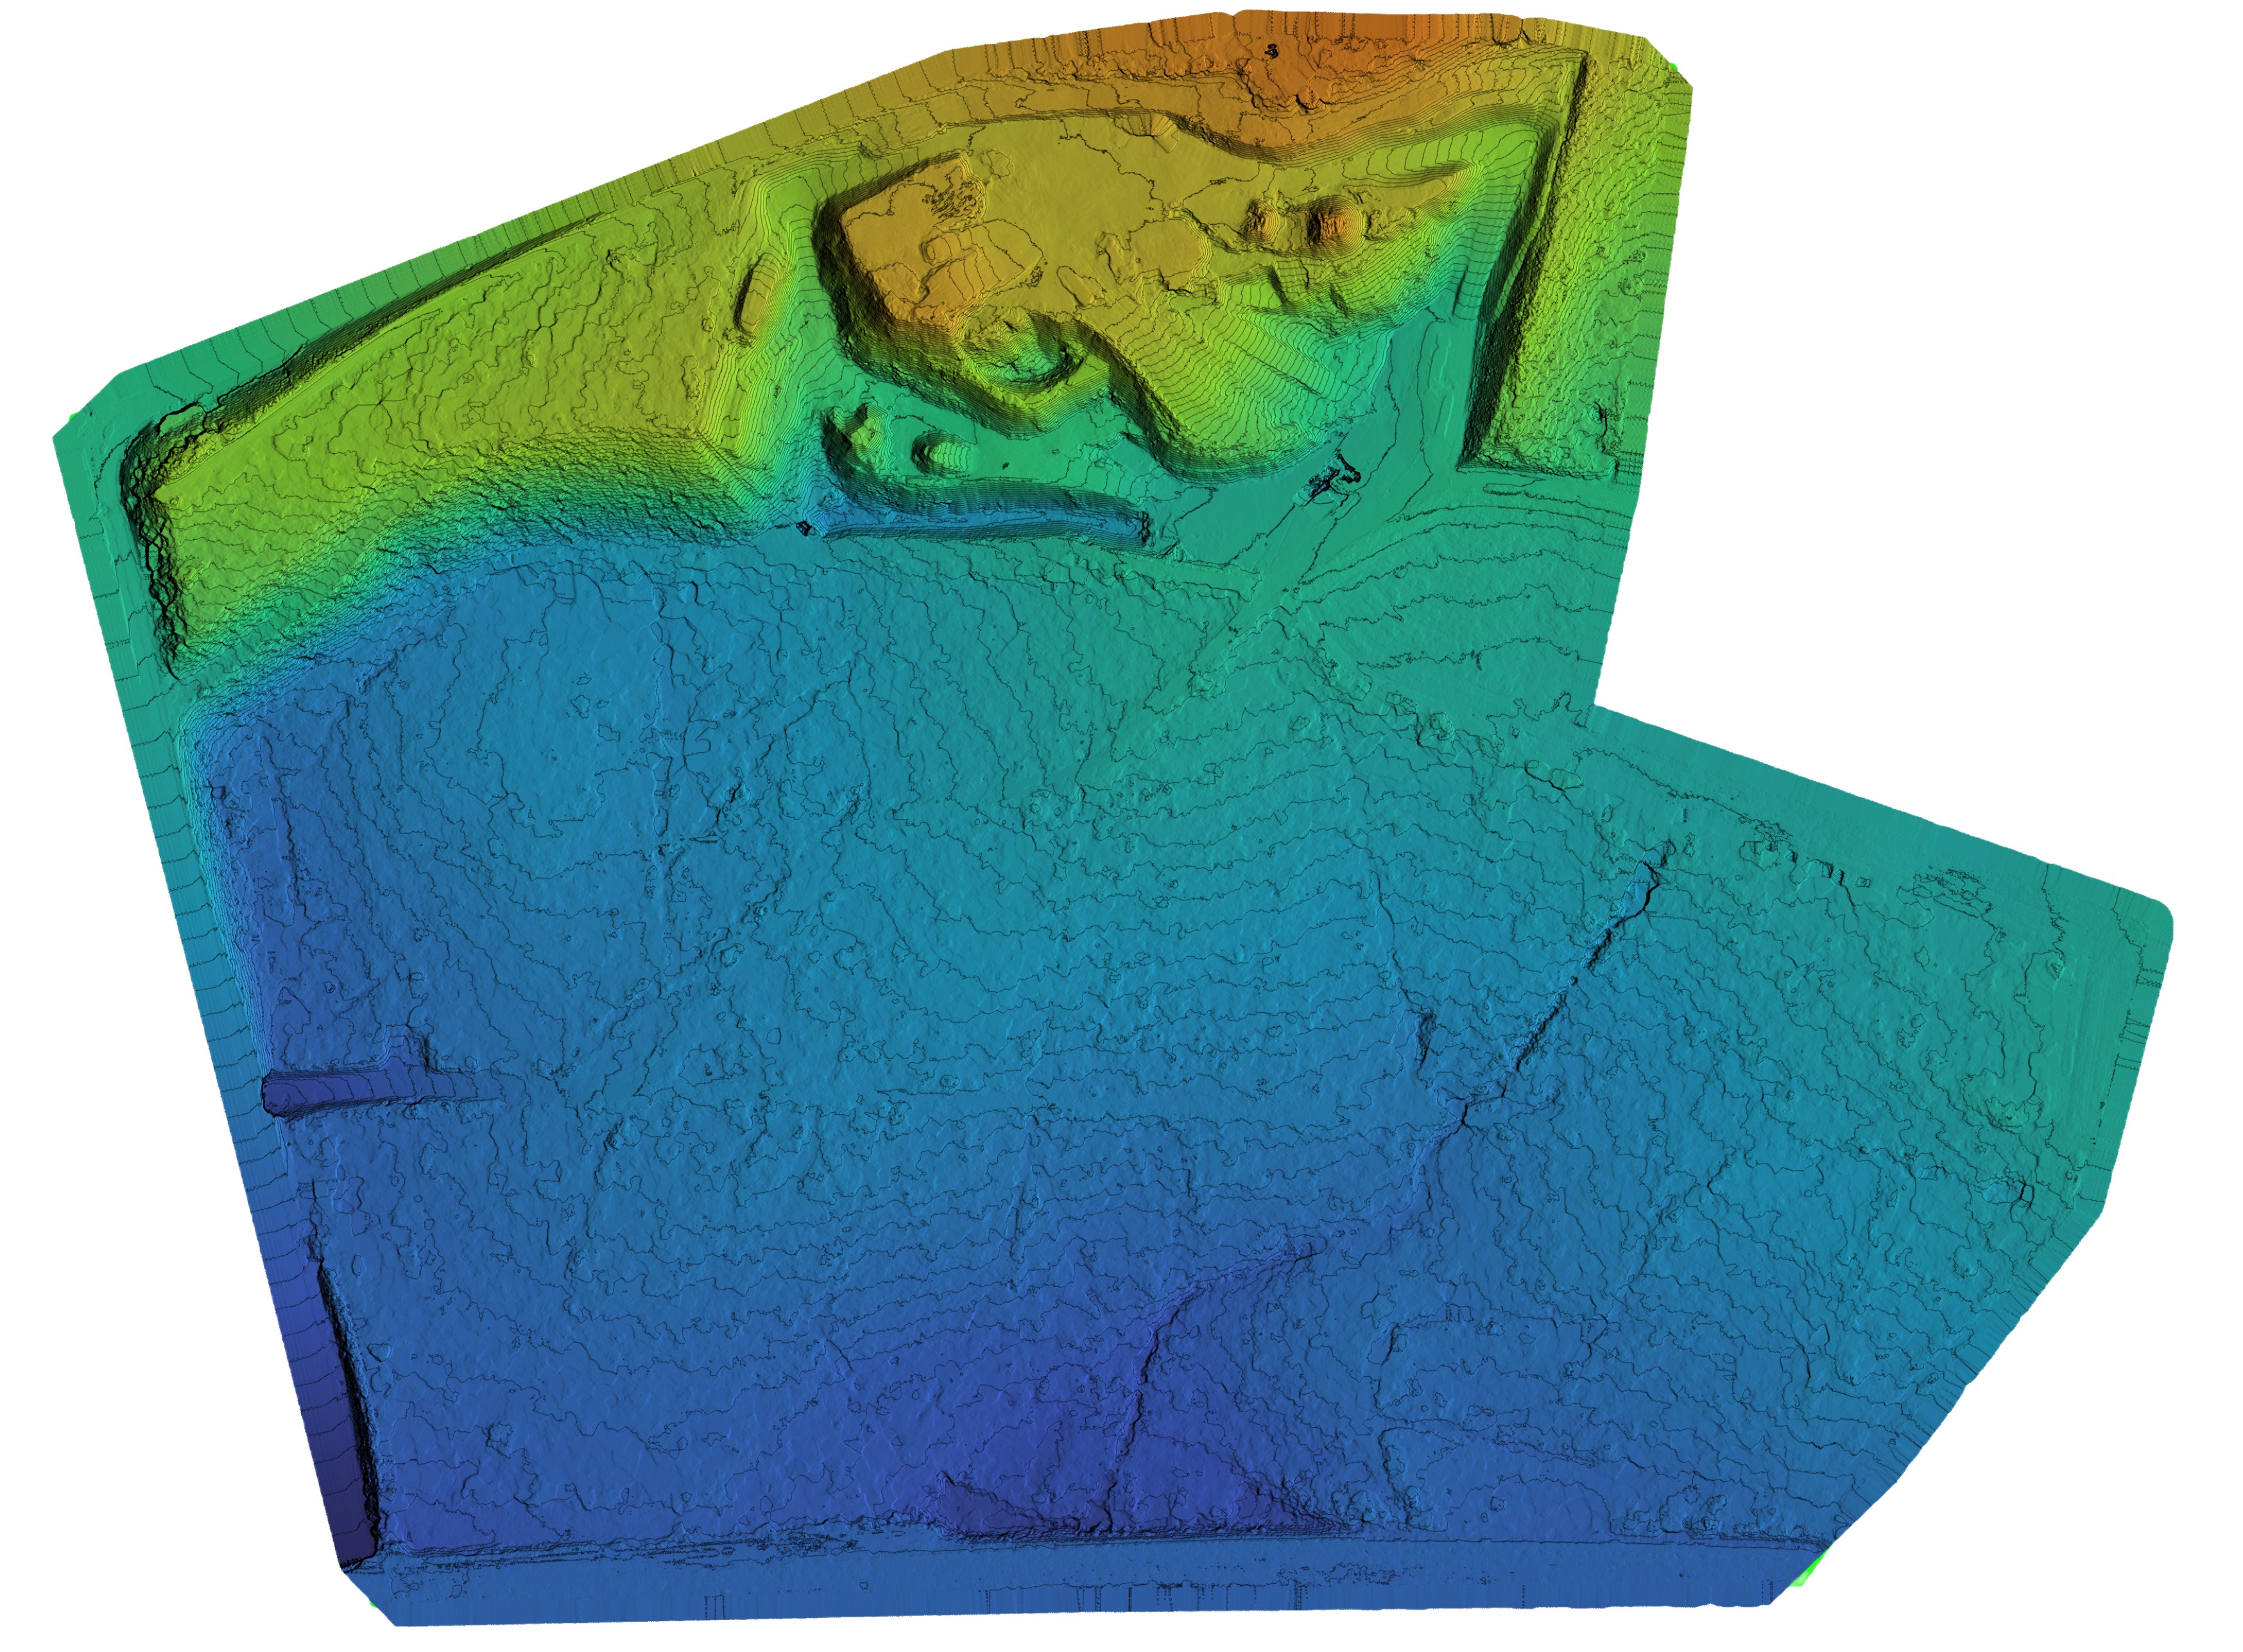
Drag the slider to compare: the digital surface model (left) shows the tree canopy, the digital terrain model (right) the bare ground beneath it.
Vegetation Classification and Mapping
Our vegetation classification service delivers detailed maps of plant cover and types using drone, satellite, and spectral data. We tailor each project to the specific vegetation and environment, selecting the best method to achieve accurate results. The outcome is a precise, visual layer showing vegetation distribution that can be explored in DATACT or any GIS platform — supporting better planning, conservation, and environmental insight.
What we Deliver
Custom classification – We can classify nearly any vegetation type, from grasslands and wetlands to shrubs, forests, and crops.
Tailored approach – The method is chosen based on the vegetation characteristics, area size, and required accuracy — using drone, satellite, or hybrid data.
Detailed vegetation maps – Deliverables include a visual layer and GIS-ready dataset showing vegetation type and coverage.
Seamless operation – We operate under our license, so you get the data without the bureaucracy.
DATACT integration – Results can be viewed, compared, and analyzed directly in DATACT or exported to other GIS platforms.
Protected species identification – Detect and map the presence of important or legally protected plant species before land development or construction.
Invasive species detection – Identify and monitor invasive plants that threaten ecosystems, soil quality, or land value.
Temporal analysis – Compare classifications across time to track vegetation changes, growth, or degradation. Deliverables include a visual layer and GIS-ready dataset showing vegetation type and coverage.
Collaborative workflow – We work closely with local experts and ecologists to ensure biological accuracy and reliable interpretation.
Key Benefits
Support better land-use decisions – Identify ecologically sensitive areas before construction or land change.
Enable targeted conservation – Map and monitor habitats of protected or endangered species.
Manage invasive plants – Detect and quantify invasive species early to plan control actions.
Monitor ecosystem change – Track vegetation growth, decline, or seasonal dynamics over time.
Save time and cost – Automated analysis replaces lengthy field surveys while maintaining scientific rigor.
Enhance environmental transparency – Provide clear, visual data to stakeholders and regulators.
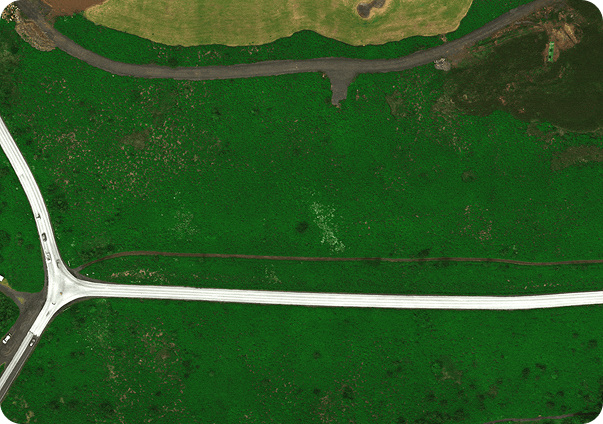
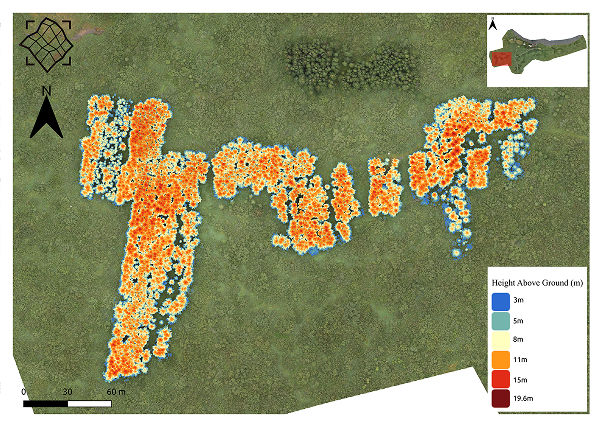
Wetland Restoration and Hydrological Analysis
Our wetland restoration service provides the geospatial foundation needed to plan, implement, and monitor restoration projects with confidence. Using drone and LiDAR data, we map terrain and hydrology in detail — identifying drainage ditches, flow paths, and areas suitable for rewetting. The results help ensure effective restoration design, minimize risk, and verifylong-term outcomes.
Why you need this data
Design restoration with precision – Understand where and how to fill ditches to achieve desired water levels.
Avoid unintended flooding – Model and plan to ensure nearby land, roads, or infrastructure remain unaffected.
Support environmental assessment – Provide verifiable, science-based data for permitting and reporting.
Monitor long-term impact – Compare hydrology, vegetation, and ecosystem development over time.
Optimize resources – Focus restoration efforts where they’ll have the greatest environmental return.
Collaborate effectively – Shared, map-based data helps landowners, ecologists, and authorities work from the same information.

What we Deliver
Detailed terrain mapping – High-resolution digital terrain models (DTMs) reveal subtle elevation differences critical for understanding water flow.
Watershed and flow-path analysis – Identify drainage patterns and catchment boundaries to predict how water will spread after restoration.
Ditch and channel detection – Automatically locate historical drainage ditches that need to be filled or blocked.
Flooding and water retention modeling – Simulate how water levels will respond to restoration measures and estimate inundation areas.
Vegetation mapping and classification – Analyze vegetation types to identify areas suitable for rewetting or sensitive habitats to protect.
Baseline and change monitoring – Document pre- and post-restoration conditions to evaluate success and track ecosystem recovery over time.
GIS and DATACT integration – All outputs are delivered as layers and maps ready for use in DATACT or any GIS platform.
Why choose us?
13+ years of experience in drone mapping, hydrological modeling, and environmental analysis.
High-resolution data from LiDAR and photogrammetry ensures centimeter-level terrain accuracy.
AI-assisted detection for identifying ditches, channels, and vegetation patterns efficiently.
Collaborative workflow – We work with hydrologists, restoration planners, and local experts to ensure results meet project goals.
Comprehensive delivery – From baseline mapping to post-restoration monitoring, all in one place.
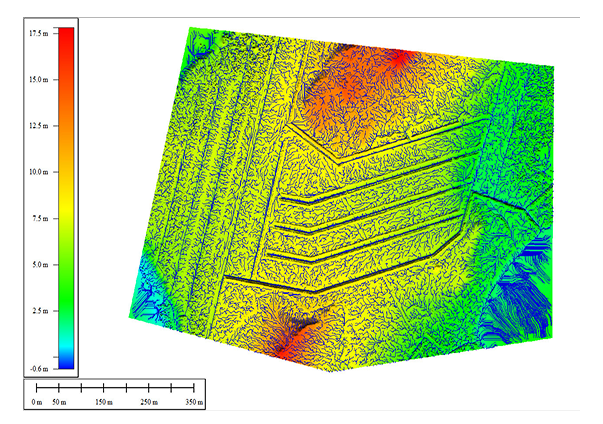
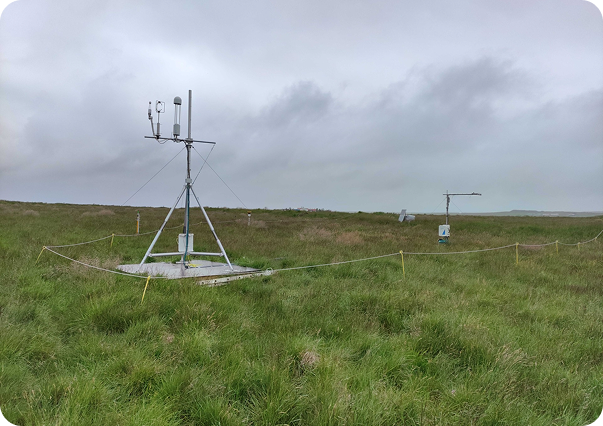
Infrastructure safety and vegetation encroachment
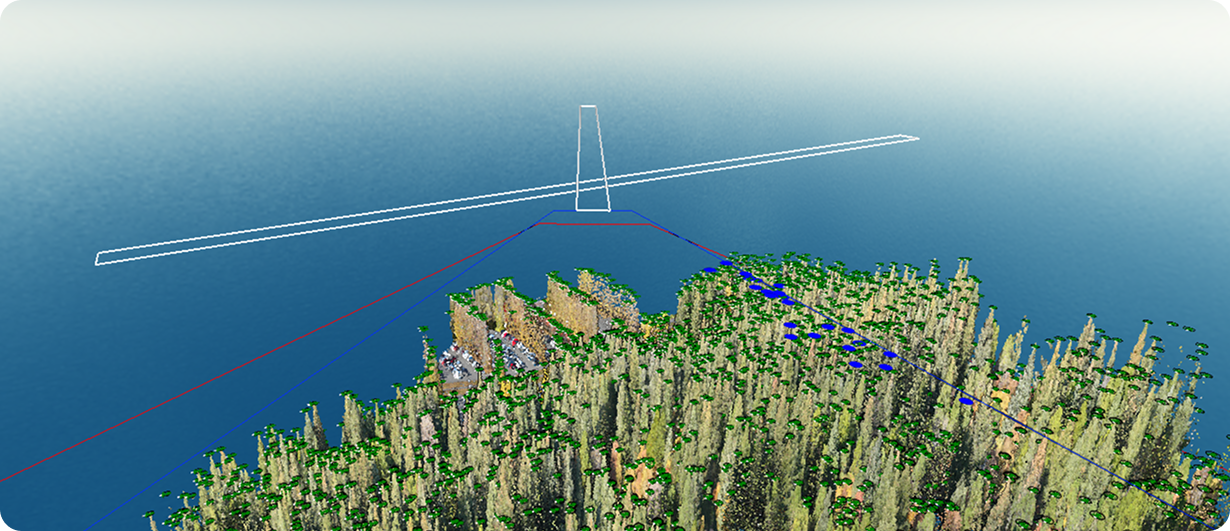
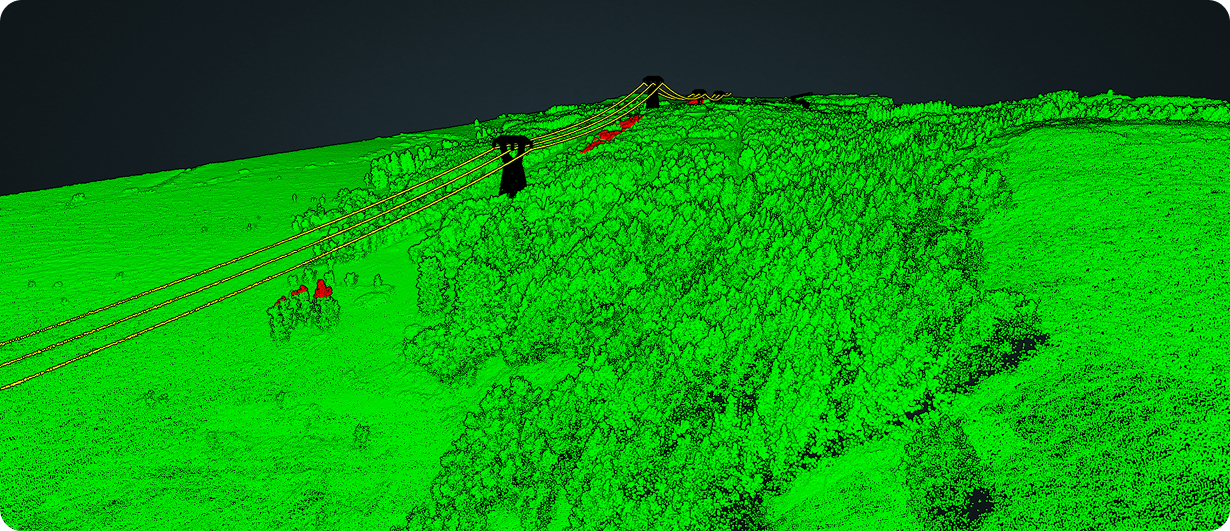
Our vegetation encroachment analysis helps infrastructure operators detect and manage vegetation growth before it becomes a safety or maintenance issue. Using LiDAR, drone imagery, and 3D modeling, we measure vegetation height and distance to assets such as power lines, roads, and runways — providing precise, repeatable insight for risk prevention and compliance.

Why it matters
Prevent service disruptions – Detect risks before they lead to outages, damage, or flight obstructions.
Improve safety – Ensure vegetation remains within regulated clearance zones for critical infrastructure.
Reduce maintenance costs – Plan vegetation management based on accurate growth trends instead of fixed schedules.
Comply with regulations – Meet aviation and utility standards through verifiable geospatial evidence.
Enhance situational awareness – Visualize proximity issues directly on the map for better planning and coordination.
What we deliver
3D vegetation modeling – Generate precise canopy models from LiDAR or photogrammetry to map vegetation height and volume.
Clearance measurement – Quantify the distance between vegetation and critical assets such as power lines, roads, or airport runways.
Growth tracking – Compare datasets over time to detect where vegetation is approaching defined safety thresholds.
Risk zone mapping – Highlight areas where trimming or vegetation control is needed.
Automated alerts – Set up thresholds for proximity violations to simplify monitoring.
Regulatory compliance support – Provide documentation for aviation obstacle clearance or power line safety inspections.
Integration ready – Deliver results as map layers and reports compatible with DATACT or any GIS platform.
Change Detection and volumetric calculations
Our change detection and volumetric analysis service helps you identify and measure how landscapes, structures, and materials evolve over time. Using repeat drone surveys, thermal mapping, and 3D modeling, we detect changes in terrain, material volume, temperature, or surface condition. The results provide clear, measurable insight for construction management, earthworks, environmental monitoring, and geothermal assessment.
What we deliver
Surface change analysis – Compare visual maps from different time periods to identify areas that have changed, such as land use, erosion, or construction progress.
3D volumetric measurements – Calculate how much material has been excavated, filled, or moved between surveys, ideal for tracking earthworks or stockpiles of gravel, rock, or soil.
Thermal change analysis – Normalize and compare thermal datasets from multiple surveys to detect temperature shifts on the surface — valuable for geothermal areas or heat loss monitoring.
Accurate baselines and references – Every analysis is anchored to precise ground control and 3D models, ensuring consistent, repeatable results.
Visual comparison layers – Highlight changes directly on the map so users can quickly identify where and how conditions have shifted.
DATACT integration – All results are available as interactive map layers within DATACT, or can be exported to any GIS platform.
Why it matters
Track construction and earthworks – Monitor material movement and calculate progress between survey periods.
Assess environmental impact – Detect changes in land cover, vegetation, or surface condition to evaluate project effects.
Support compliance and reporting – Provide accurate, visual evidence of change for environmental monitoring or regulatory documentation.
Optimize resource use – Quantify material stockpiles or excavation volumes to reduce waste andimprove logistics.
Monitor geothermal or thermal variation – Detect surface temperature changes that may indicate geothermal shifts, leaks, or inefficiencies.
Make proactive decisions – Identify issues early by seeing exactly what has changed and where.
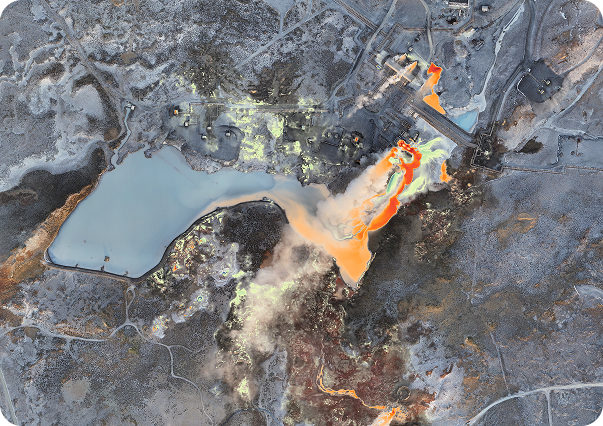
Change detection between two survey flights over a geothermal area: zones with significant surface change are highlighted in colour on the orthomosaic.
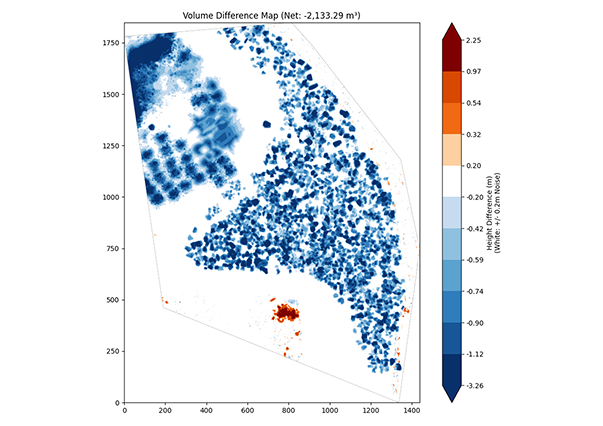
Volume difference map between two surveys: blue shows material removed, red material added (net change −2,133 m³; differences within ±0.2 m are treated as noise).
Our Analysis Philosophy
From Data to Decisions
Our approach is founded on turning complex datasets into clear, confident actions foryour organization.
001
Science-Driven & Technology-Powered
Our methods are rooted in a deep scientific foundation, validated through years of collaboration on international research projects. We leverage this expertise with advanced AI and machine learning tools to deliver analysis that is not just descriptive, but predictive and insightful.
002
Data-Agnostic Expertise
Our experience is vast. We are equally adept at analyzing high-resolution drone LiDAR, multispectral satellite imagery, and publicly available global datasets. We use the best data source for the job, ensuring the most efficient and effective solution.
003
Collaborative Partnership
We function as a seamless extension of your team. We can work independently to deliver turnkey analysis or collaborate closely with your on-site experts and scientists to integrate critical ground-truth data, ensuring our results are perfectly aligned with the realities in the field.
004
Revealing the Unseen
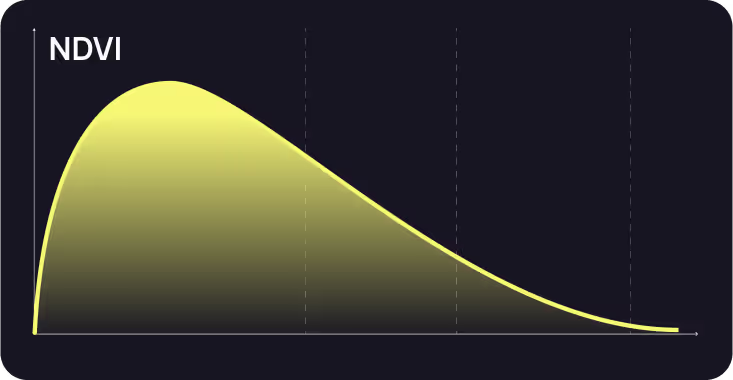
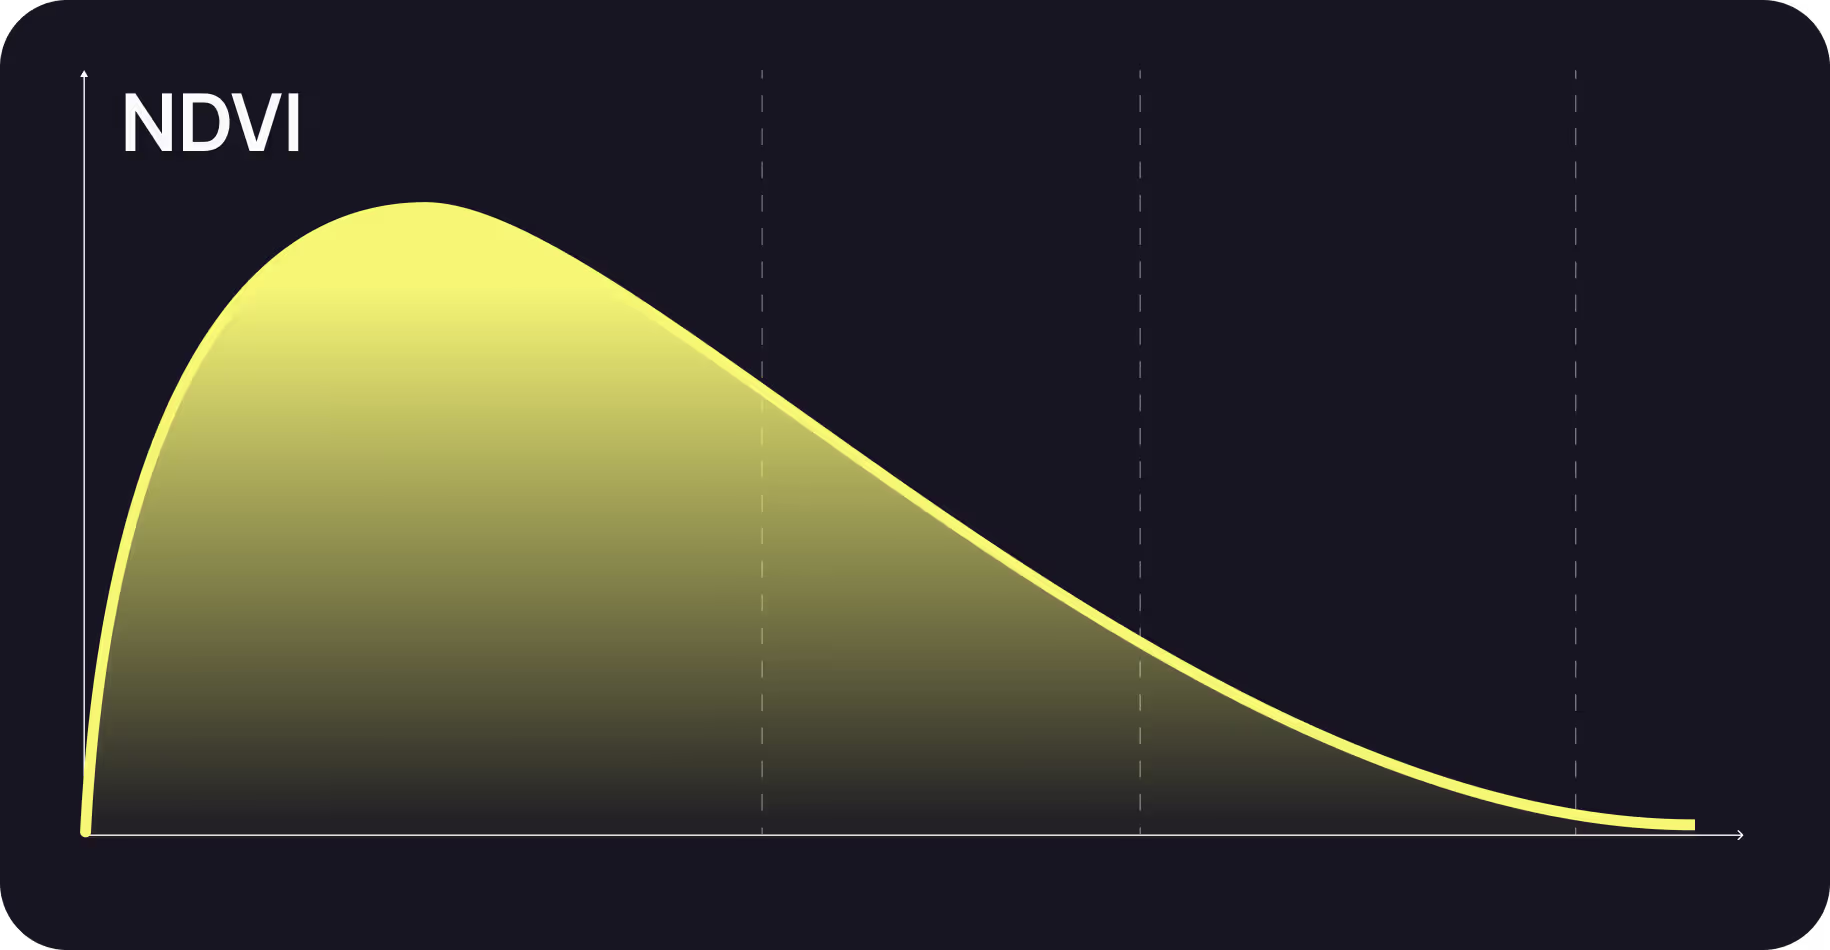
Remote sensing data tells a story that can be missed on the ground. By analyzing frequent data captures over time, we can spot subtle, yet critical, trends that are invisible to the naked eye. We have seen this first-hand where a simple NDVI graph revealed a drop in vegetation health due to a short-term drought that on-site experts had not noticed. This ability to see thebigger picture allows for proactive, rather than reactive, management.
Flexible
Engagement Models
We tailor our engagement to fit your exact needs and internal capabilities.
001
Analysis as a Service: You provide the data, and we provide the insights. This is ideal for clients who have data but lack the specialized tools or expertise for advanced analysis.
002
End-to-End Project Partnership: We manage the entire project lifecycle, from strategic data collection planning and field acquisition (drone, satellite, and ground-truth) to final analysis and reporting.
003
Embedded Research & Development: We join your project team or consortium, acting as the dedicated geospatial analysis and R&D partner, pioneering new methods to solve unique challenges.
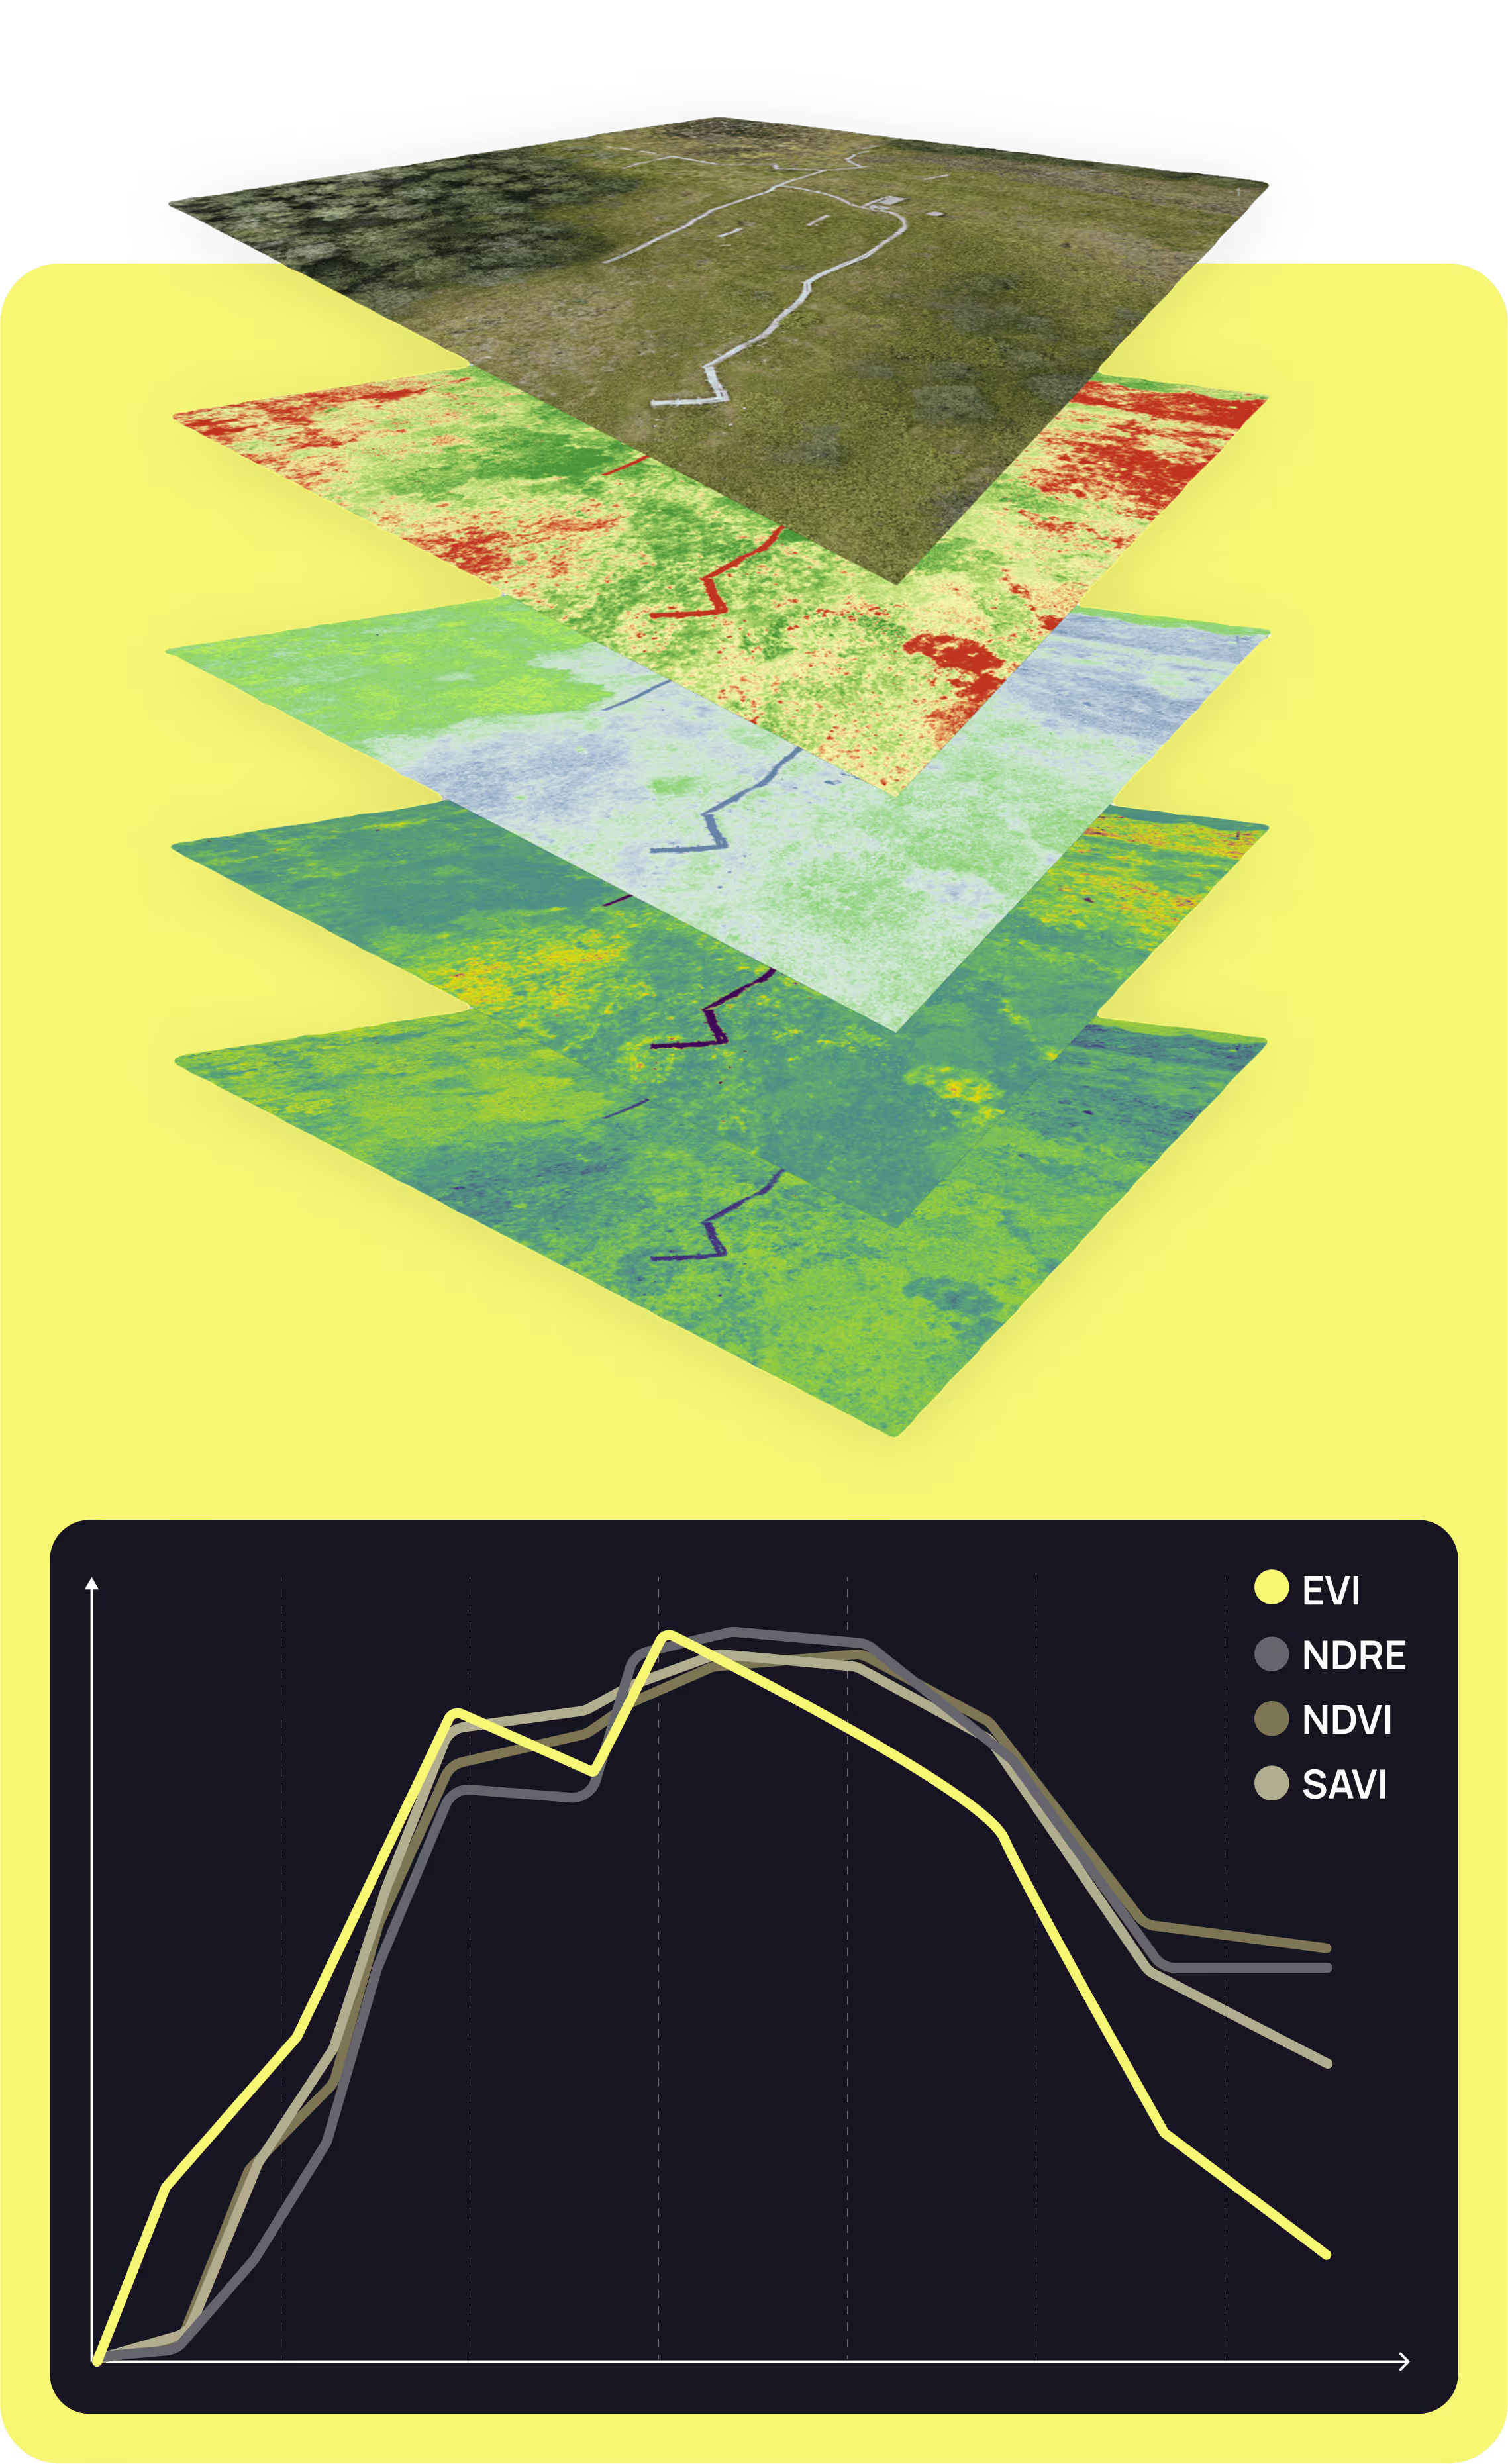
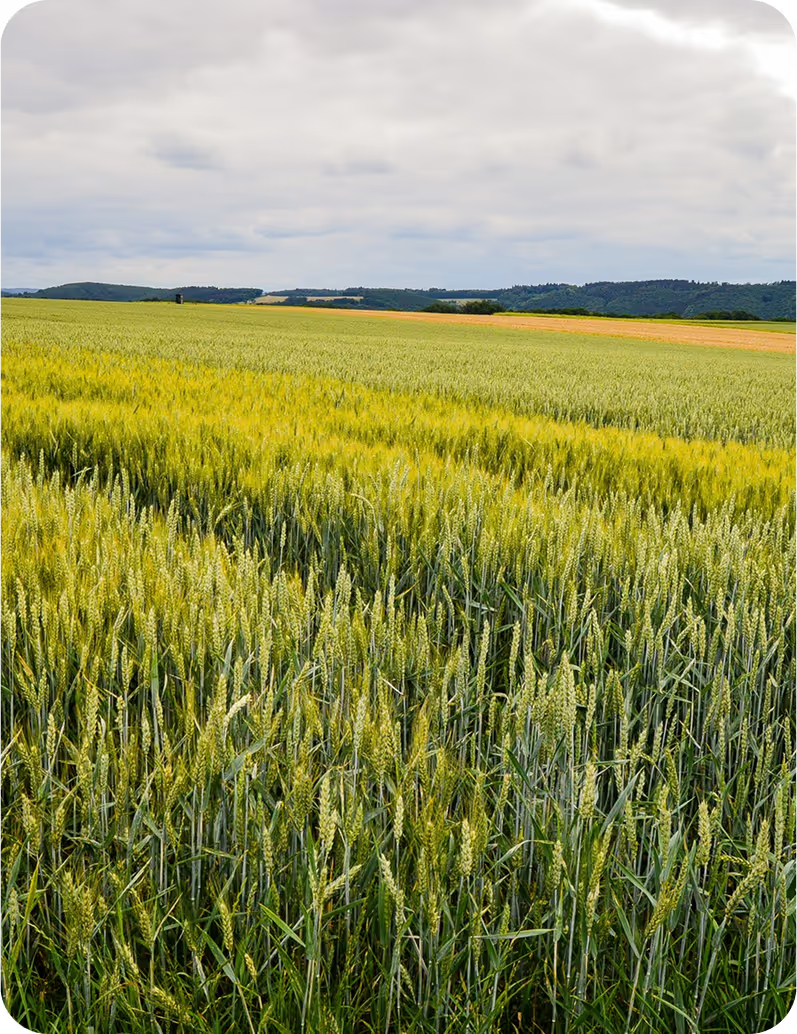
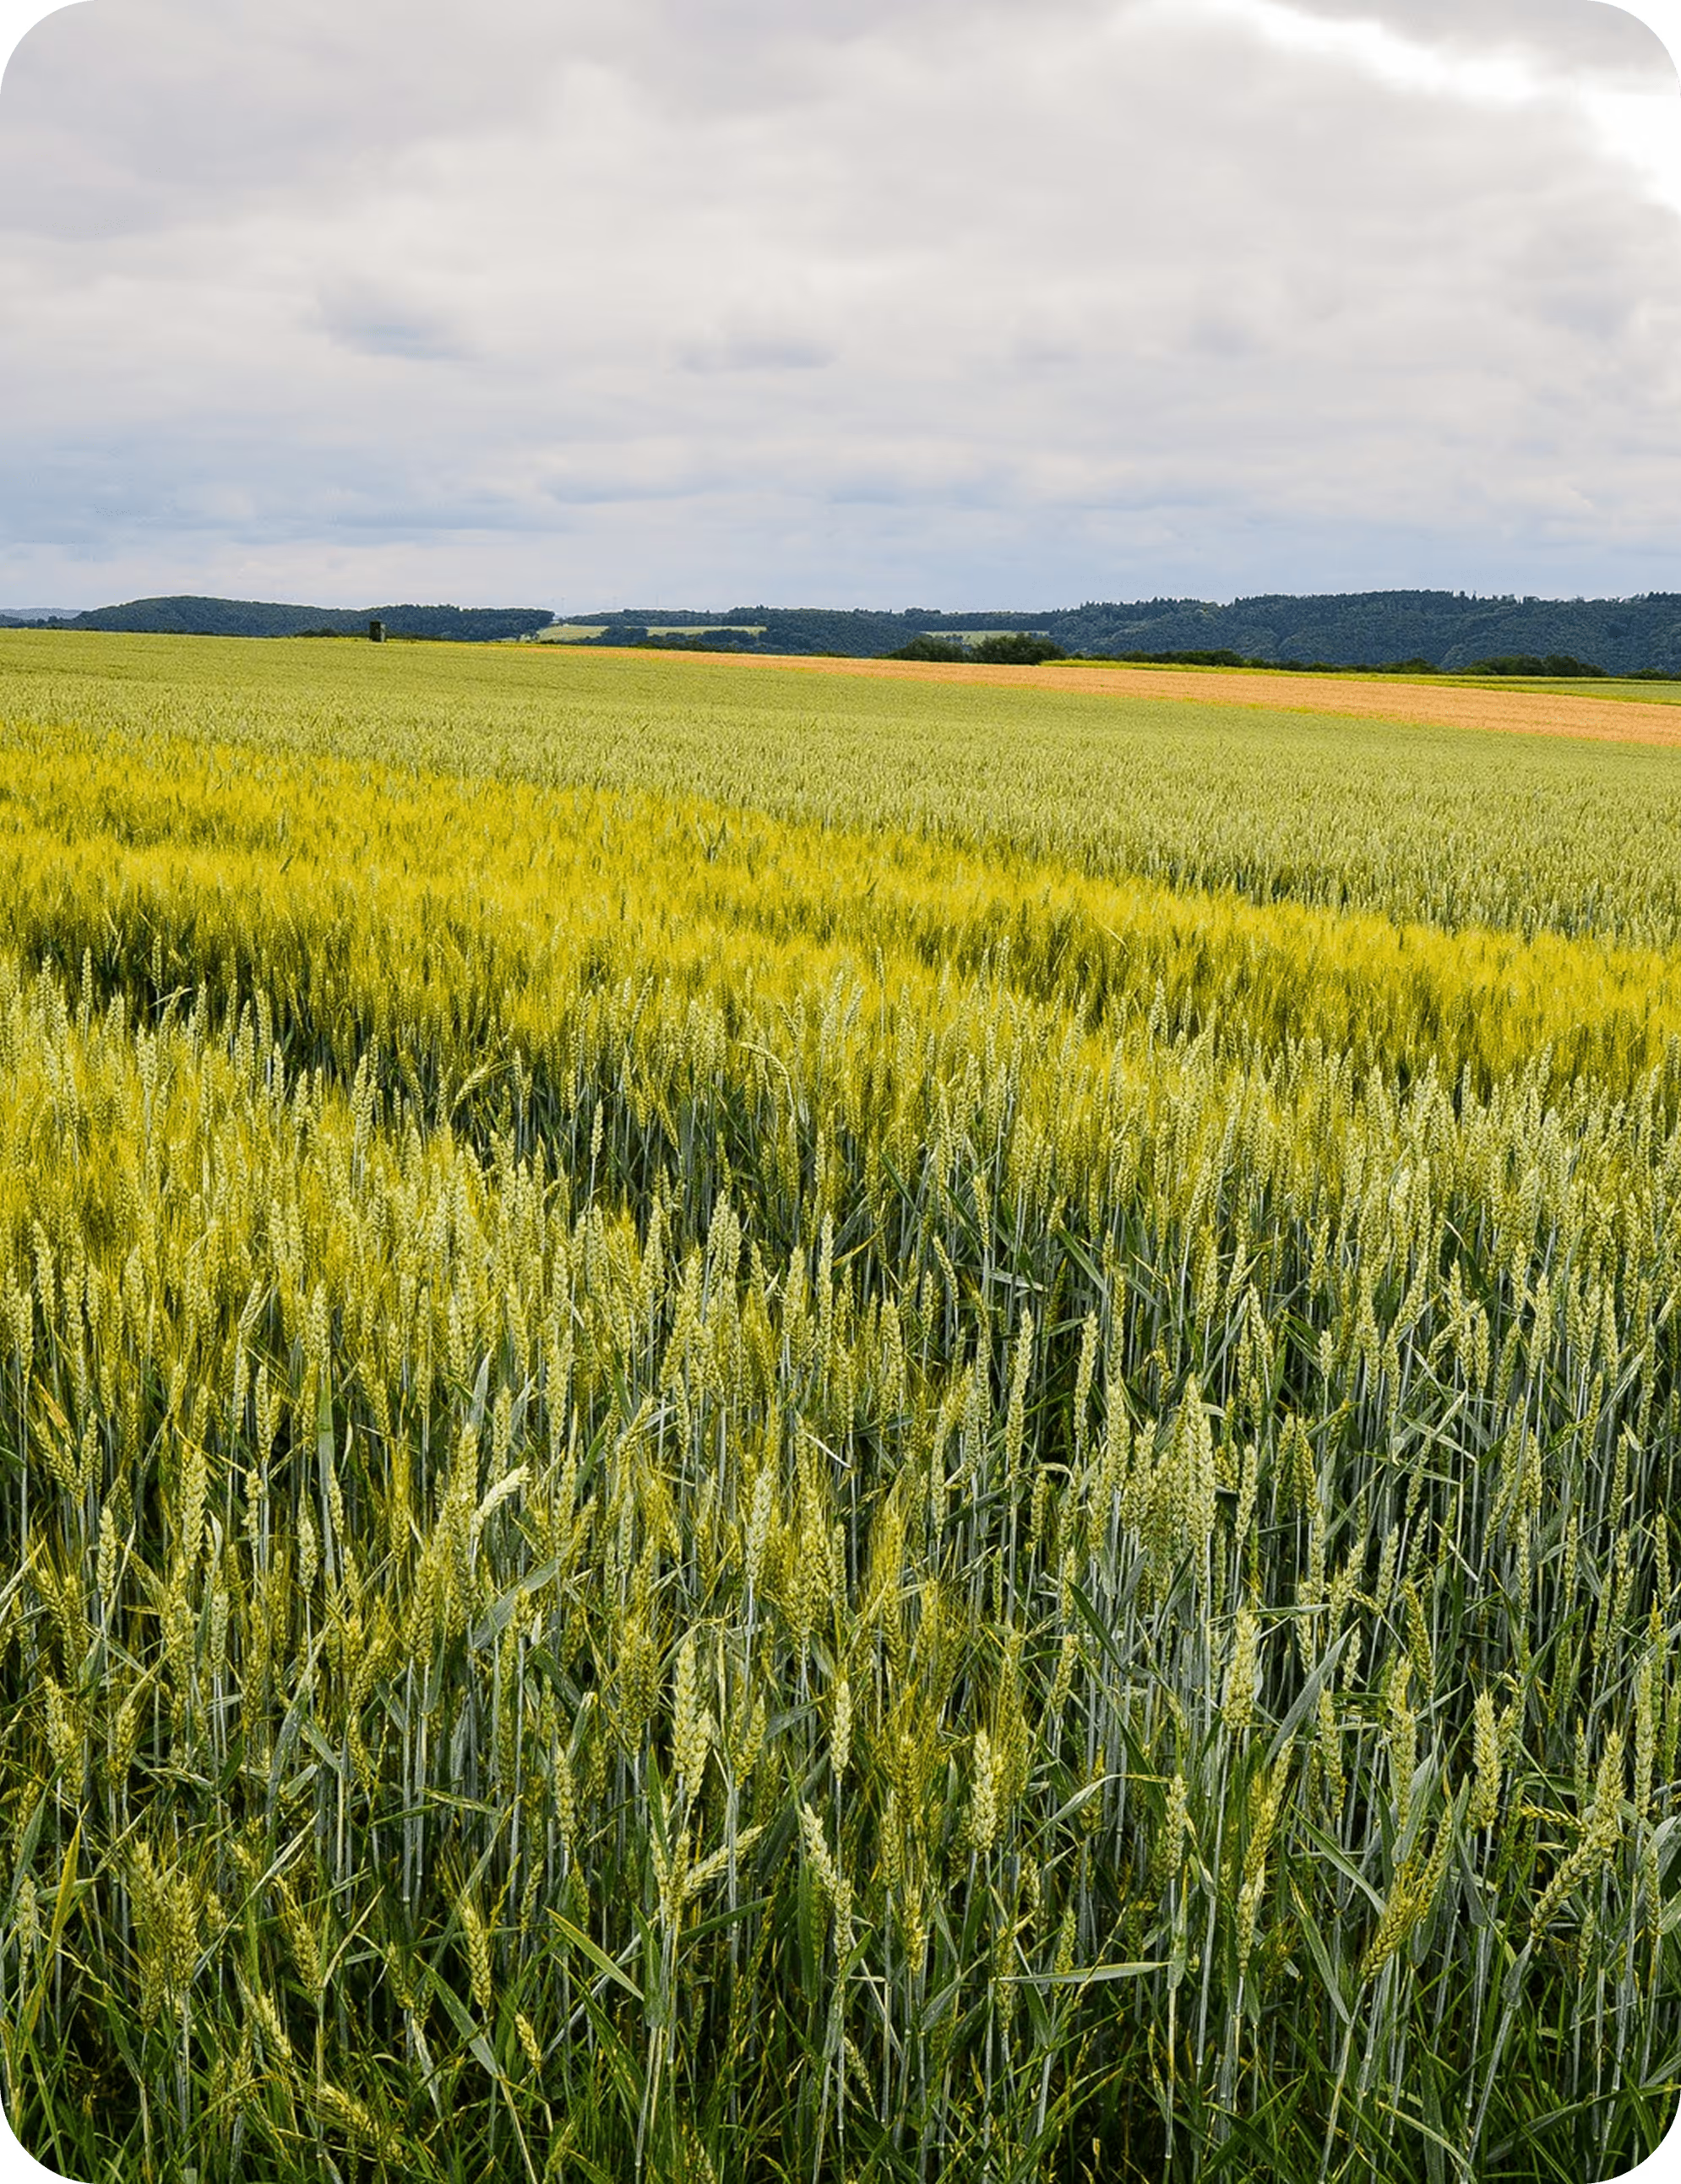
One survey, many data layers: the orthomosaic (top) and derived vegetation indices such as EVI, NDRE, NDVI and SAVI. The chart shows how these indices develop over a growing season.
Our Scientific Foundation & Global Experience
Our project experience spans the globe, with successful deliveries on every continent except Antarctica. We are trusted by a diverse range of clients, from small, agile teams of 2-5 people to some of the largest and most respected companies in the world.
Our credibility is built on a strong foundation of scientific research and global project execution. We have participated in numerous European research projects, some funded by the EU, investigating critical environmental processes. This work, often done in collaboration with local experts like national forest services, allows us to continuously validate and refine our methods, ensuring we remain at the forefront of geospatial science.
Research & Publications
We believe in contributing to the scientific community.
Our team has been a part of numerous studies and publications.
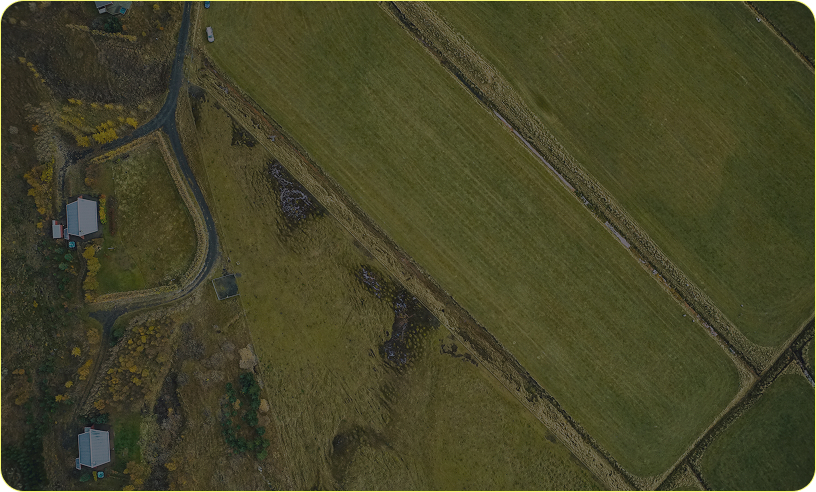

Comprehensive Geospatial Capabilities
The examples above represent only part of what we can do. Our team offers a comprehensive range of analytical services that can be tailored to the unique needs of each project — from infrastructure development to environmental management and natural resource monitoring.
Infrastructure Integrity & Asset Management
We use point cloud and imagery analysis to monitor the safety, compliance, and progress of critical infrastructure.
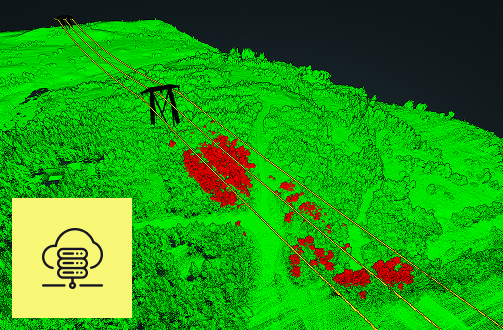
- Vegetation Encroachment Analysis: Automated detection of vegetation nearing or infringing on infrastructure like powerlines, pipelines, railways, and airport runway approach paths.
- Construction & Earthworks Monitoring: Precise volume calculations, cut-and-fill analysis, and progress tracking for construction sites and quarries.
- Infrastructure Change Detection: High-precision monitoring of hydro dams, bridges, and other critical structures to detect deformation, subsidence, or change over time.
- Slope Stability & Geohazard Analysis: DTM and point cloud analysis to identify areas at risk of landslides or erosion.
From Data to Decision – The Power of Analysis:
- Before: You have a massive 3D point cloud of a powerline corridor—billions of points that are impossible to interpret manually.
- After: We deliver a precise report listing the exact location of 15 specific trees that are a direct threat to the powerlines, allowing you to dispatch maintenance crews efficiently and prevent outages.

Environmental & Ecosystem Analysis
We specialize in detailed analysis of natural environments for EIAs, monitoring, and Nature-Based Solution projects.
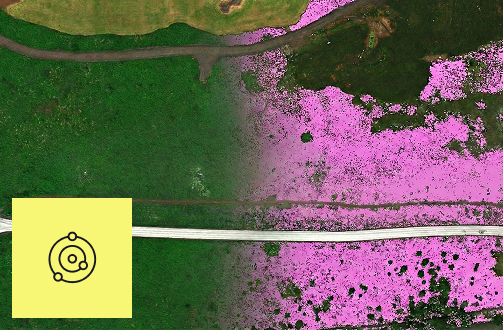
- Advanced Forest Inventories: Beyond simple metrics, we deliver detailed reports on tree height, canopy density, canopy cover, forest biomass estimation, carbon stock calculation, and forest gap analysis.
- Vegetation Health & Species Classification: Using multispectral and hyperspectral data to assess vegetation health (NDVI and other indices) and perform AI-driven classification of plant species and invasive species mapping.
- Wetland & Hydrological Analysis: Mapping wetland boundaries, monitoring water level changes, and analyzing carbon cycles in restored ecosystems.
- Habitat Suitability Mapping: Combining various data layers to model and identify ideal habitats for specific wildlife species.
From Data to Decision – The Power of Analysis:
- Before: You have a high-resolution aerial photo of a 1,000-hectare nature reserve. Manually counting a specific invasive plant species to assess its spread would take months of tedious work.
- After: Our AI model analyzes the entire image in hours and delivers a clear result: an estimated 1.2 million instances of the invasive plant, with a heatmap showing the densest concentrations. This allows you to target eradication efforts where they will have the most impact.
Advanced Classification & Change Detection
We leverage AI and machine learning to perform large-scale analysis and uncover trends.
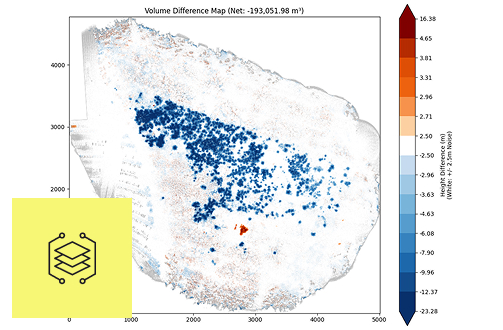
- Land Use / Land Cover (LULC) Classification: Highly accurate, automated mapping of land cover types for environmental monitoring and planning.
- Automated Feature Extraction: AI-powered detection and counting of specific objects, from individual trees and agricultural assets to infrastructure components.
- Long-Term Change Detection: Time-series analysis using historical satellite and aerial data to quantify environmental or land-use change over years or decades.
From Data to Decision – The Power of Analysis:
- Before: You have 20 years of satellite imagery for a region, but understanding the pattern of change is difficult.
- After: We provide a clear, concise report showing that the region has lost 15% of its wetland area to agricultural expansion, empowering you to make data-driven policy recommendations.
See how DATACT
brings your data to life
