Zentralisierte Umweltdaten
Manage the world you measure
DATACT ist Ihr sicherer Knotenpunkt zum Speichern, Anzeigen und Verstehen naturbezogener Daten — von Artenbeobachtungen und Feldfotos bis hin zu Kohlenstoffspeicher und Umweltbelastungen.
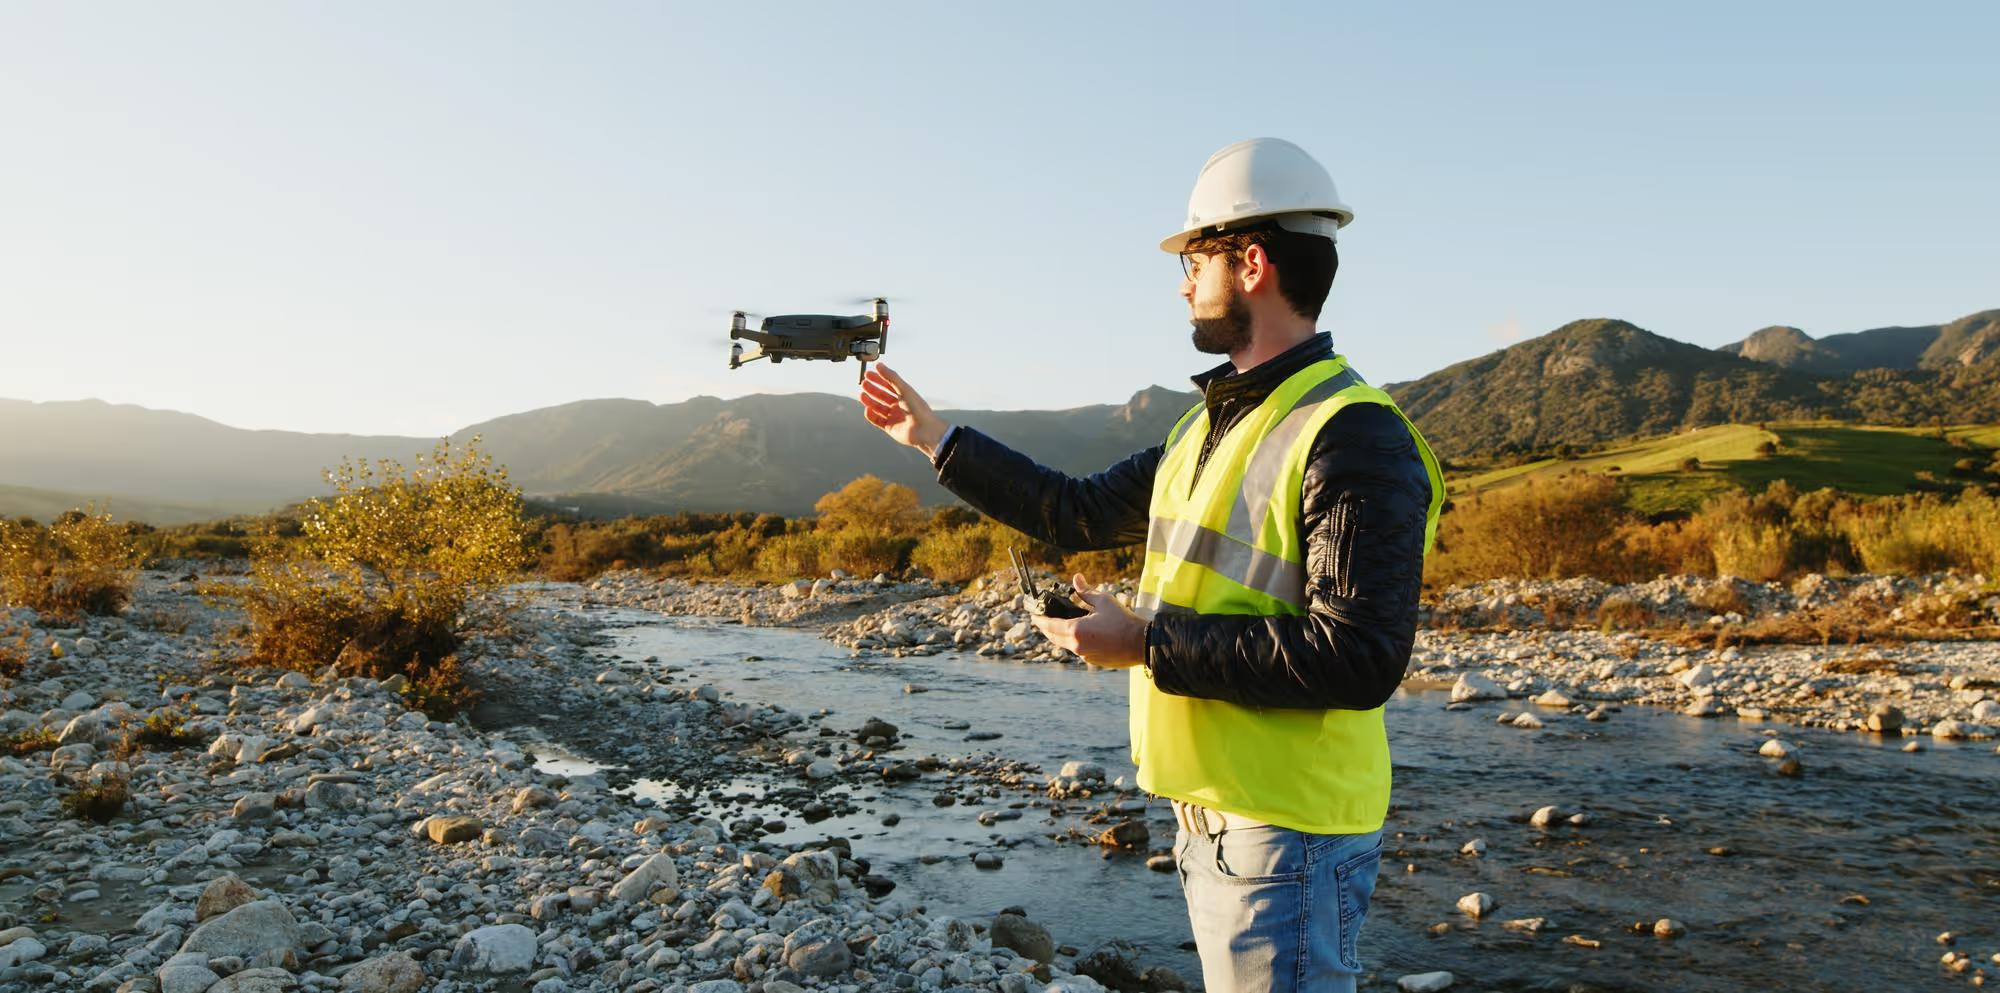
Built for the people who capture, manage and protect our land
Whether you fly the drones, own the assets or report on nature, DATACT turns your drone, satellite and field data into answers that everyone on the project can use.
Deliver results, not hard drives
- Process client flights into orthomosaics and 3D models in the cloud
- Hand over a secure link or invite clients as guests: no more file transfers
- Turn one-off flights into recurring monitoring contracts
- Earn 15% of your clients’ DATACT revenue for 5 years as a DATACT partner
See every asset in its real-world context
- Manage power lines, substations, roads, pipes and buildings as assets on one map
- Overlay drone imagery with utility networks, property lines and flood zones
- Measure, compare over time and document site conditions
- Give engineers and contractors one source of truth, with SSO for enterprise
Monitor, report and get permits faster
- Combine drone, satellite and field photos to track habitats and land-use change
- Define footprints, monitoring areas and areas of influence for every project
- Overlay protected areas, vegetation and hydrology to spot risks early
- Share clear evidence with authorities and stakeholders through public channels
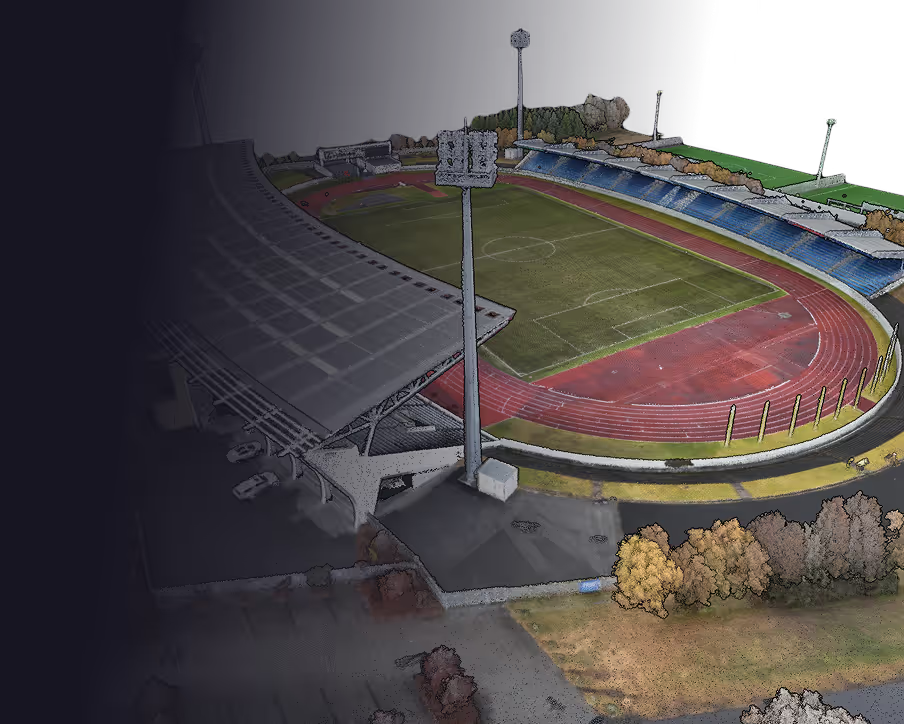
Verwandeln Sie Ihre Drohnenfotos in atemberaubende Karten und 3D-Modelle
Flexible Bereitstellungsmodelle
Über die Softwarelösung können unsere Kunden relevante Daten einbeziehen, einschließlich Daten, die von unseren Teams gesammelt wurden, und Daten von Drittanbietern von Satelliten und lokalen Drohnenbetreibern.
Abonnement-Modelle
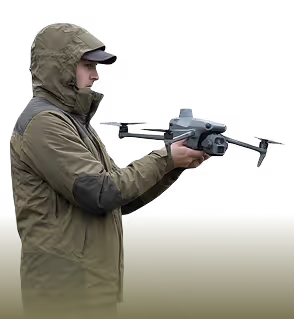
Your pilots
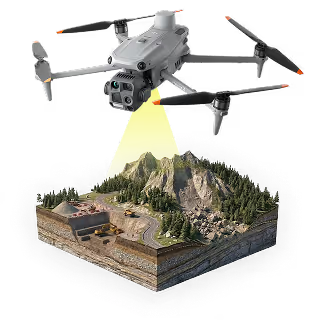
Fortschrittliche Tools und Workflows für wachsende Teams und häufige Missionen
Skalierbare Lösungen — individuelle Integrationen und Premium-Support
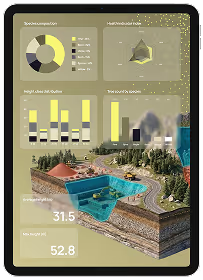
Insight
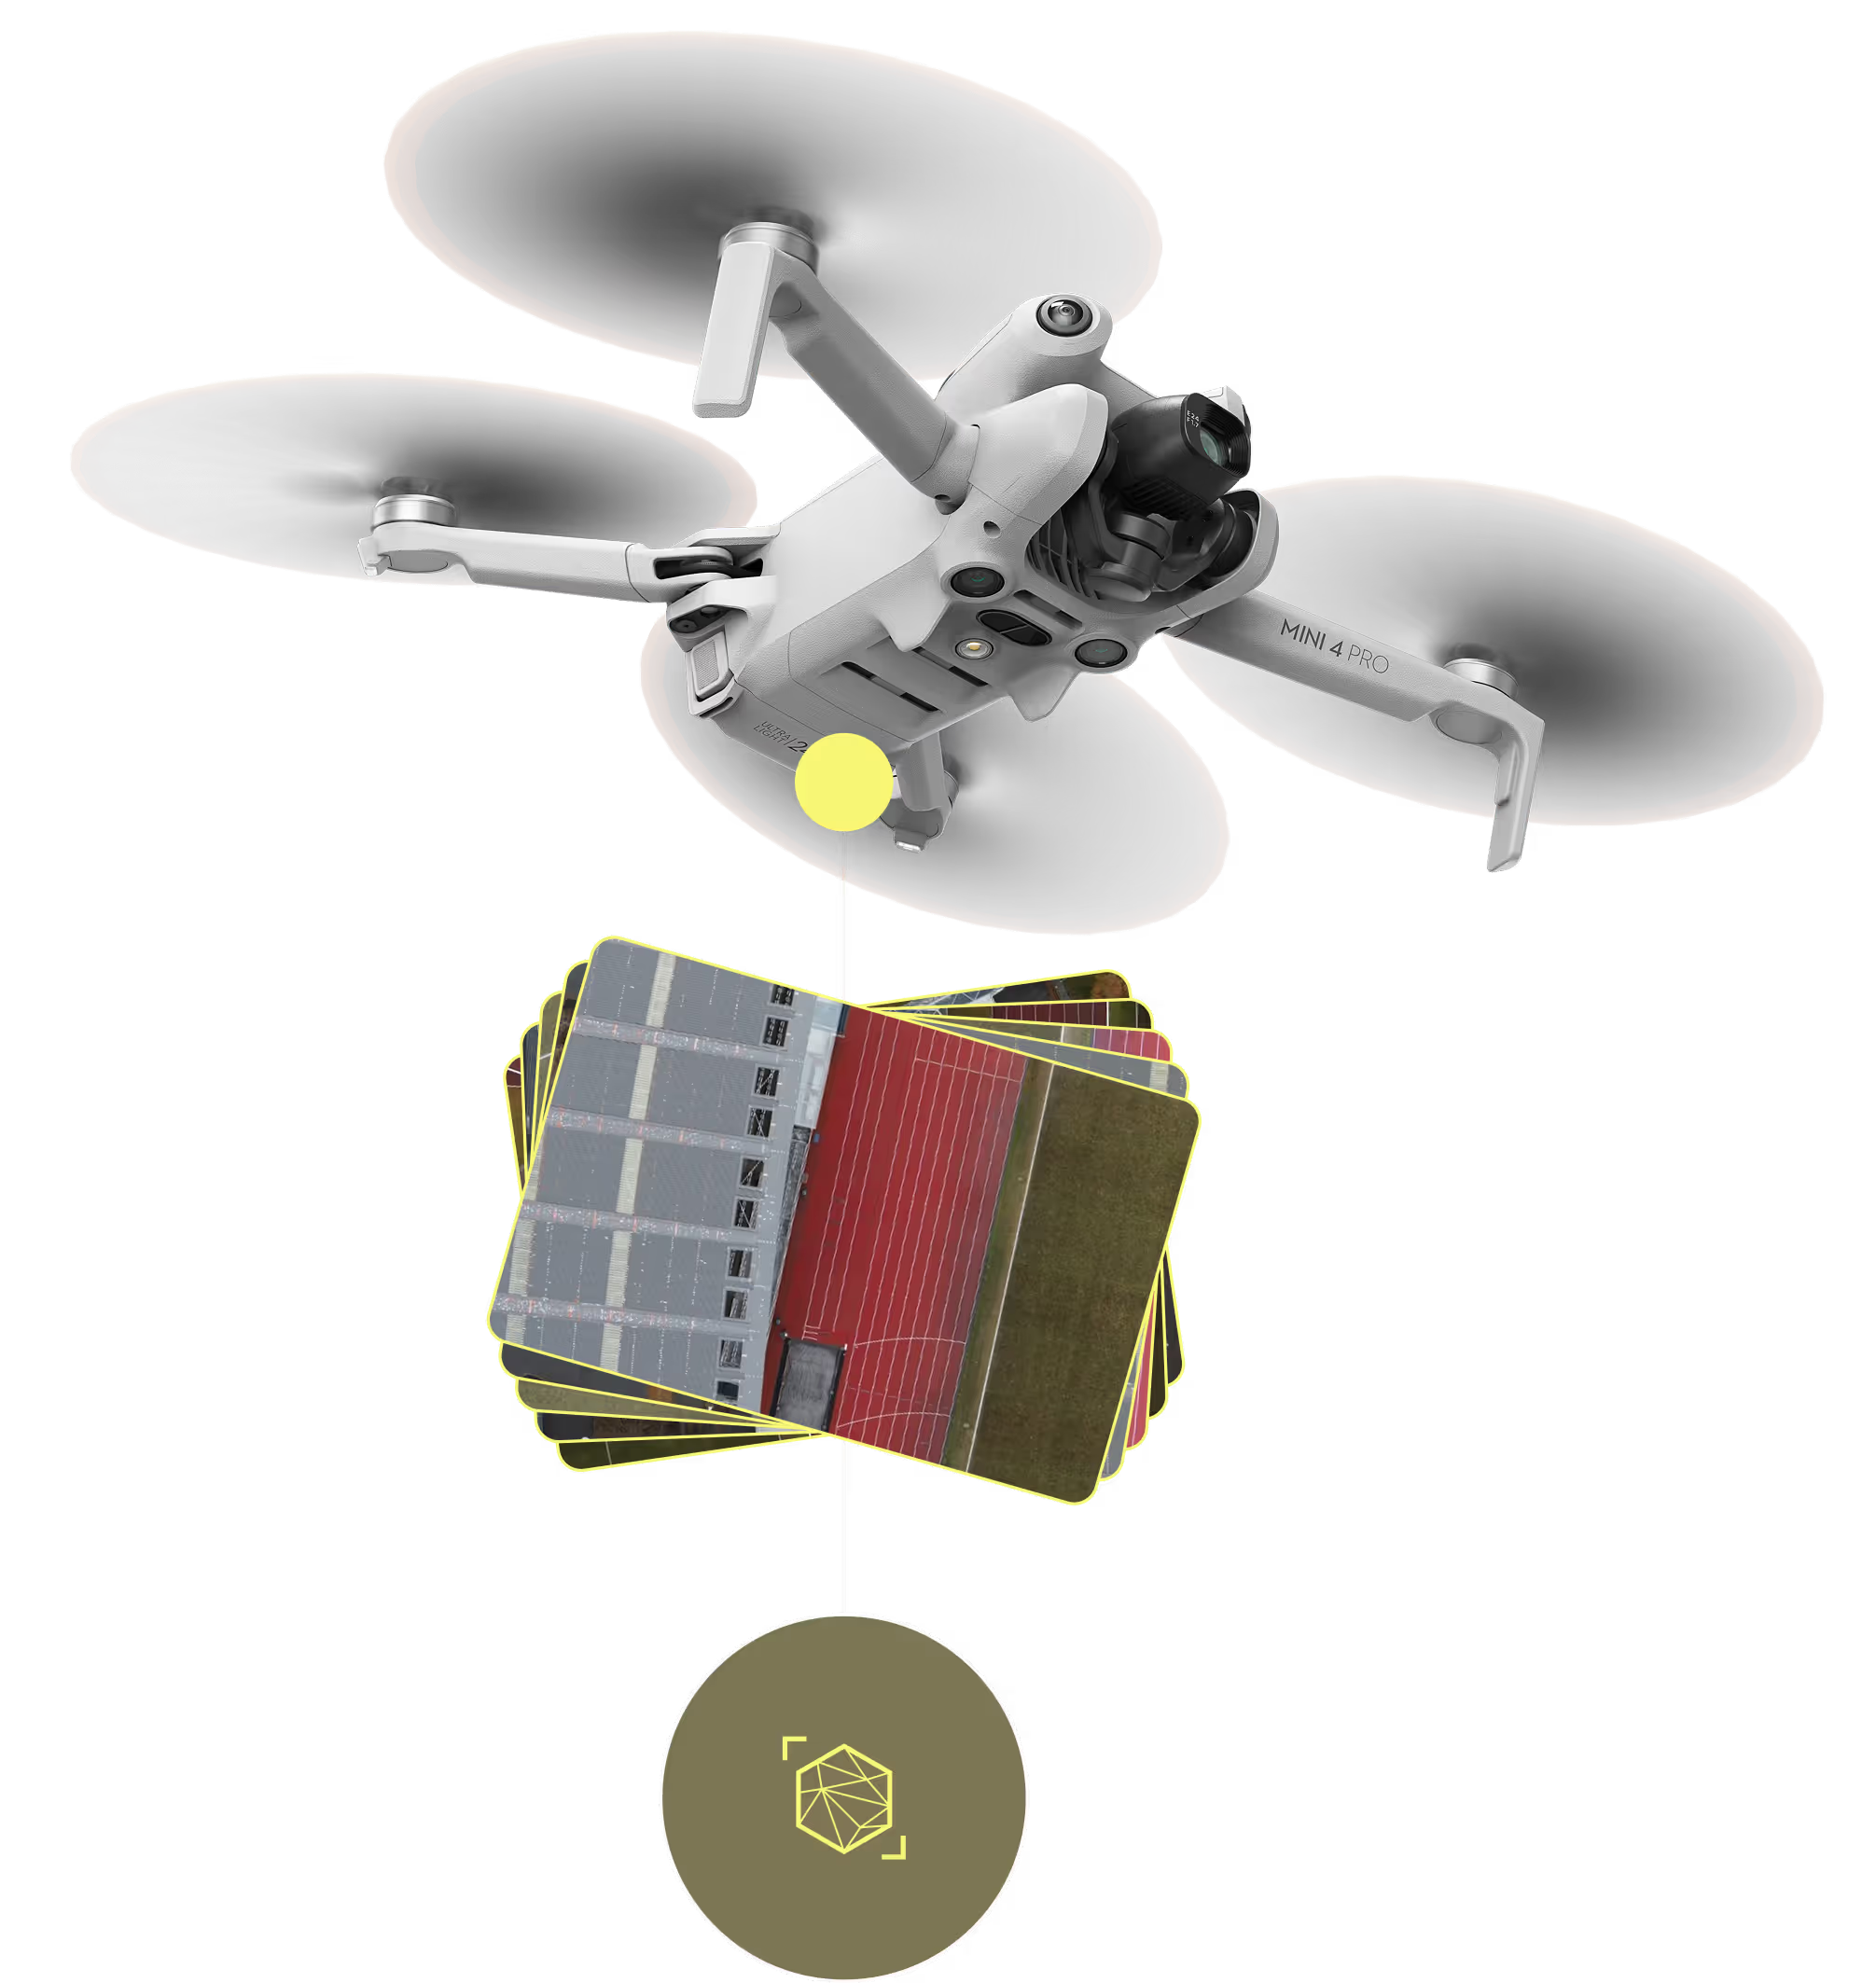
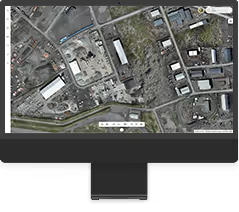
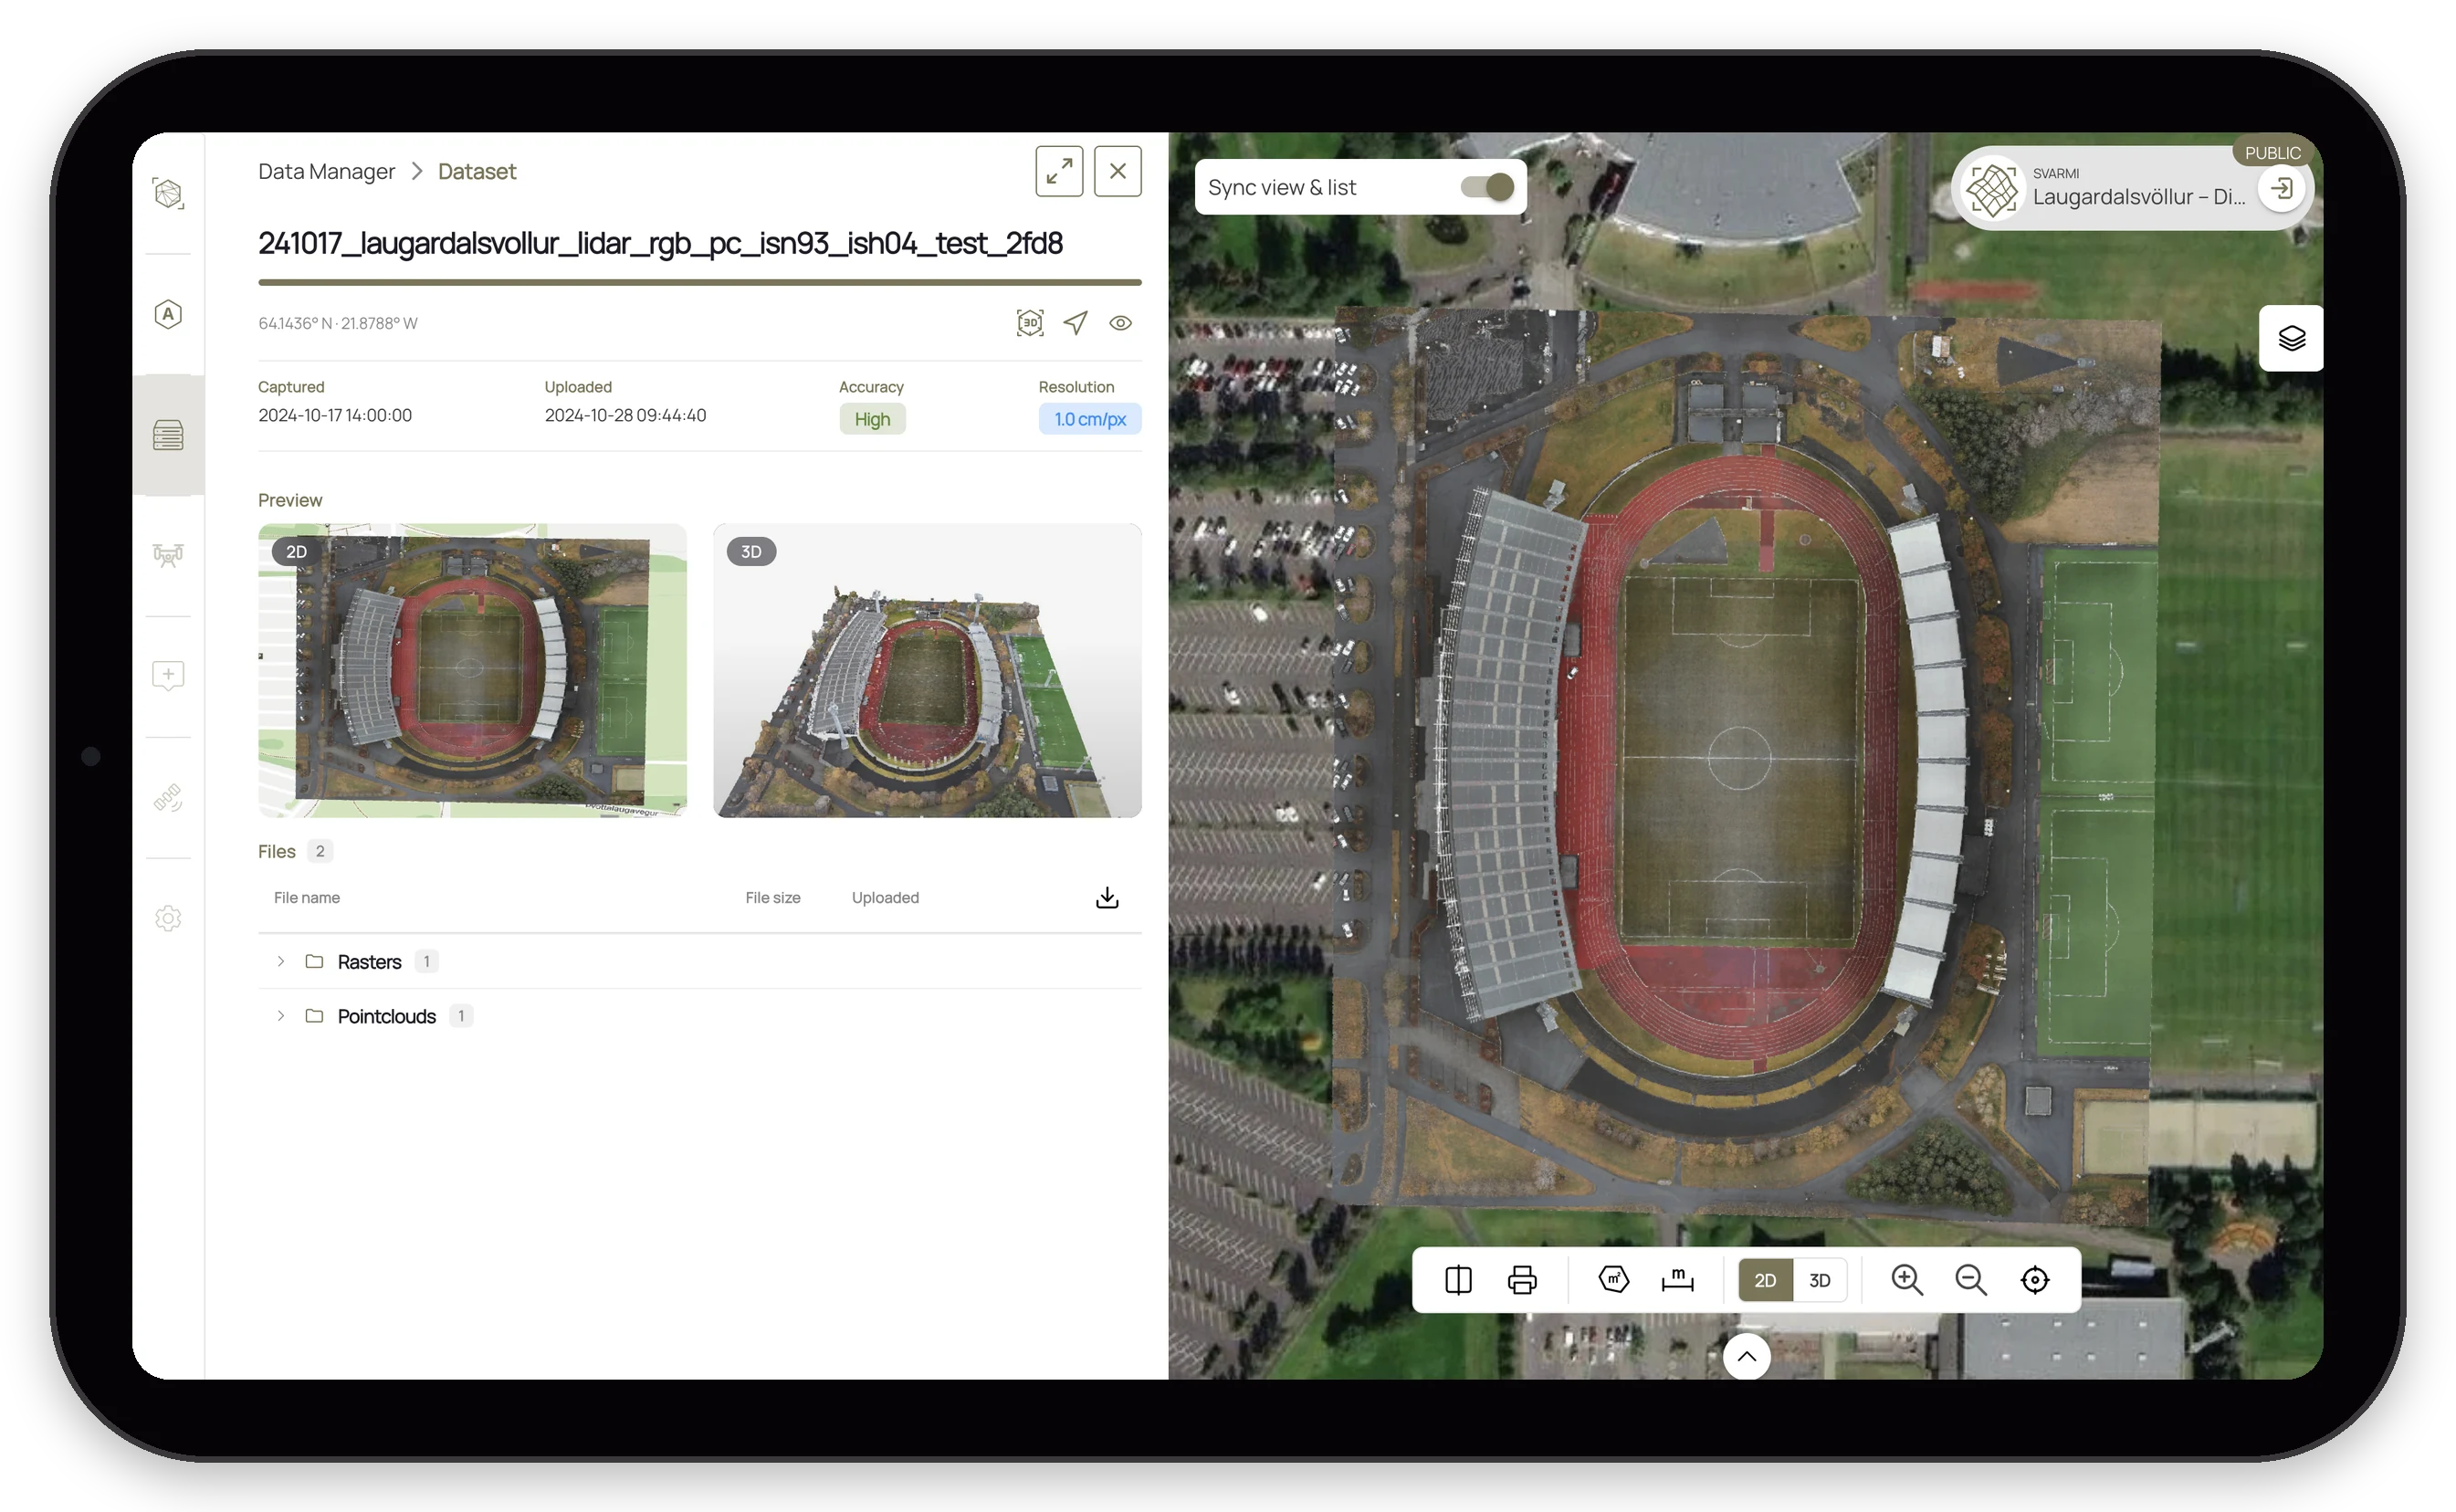
From flight to insight: upload your drone data and let DATACT handle the heavy lifting. Our cloud-based processing converts raw images into stunning 2D and 3D models, providing the visual clarity you need to make smarter, faster decisions.
Your clients want answers, not raw images
DATACT gives drone operators a professional way to process, deliver and keep selling data. Fly once, deliver in DATACT, and turn every project into an ongoing client relationship.
Process in the cloud
Upload your flight images and DATACT builds 2D orthomosaics and 3D models in the cloud. No processing workstation, no software licences to manage.
Deliver with a link
Share results in a client channel or invite clients as guest users. They view, measure and comment on the map in their browser, instead of downloading gigabytes.
Grow recurring revenue
Repeat flights become monitoring: compare datasets side by side over time. Refer clients with your partner link and earn 15% of their DATACT revenue for 5 years.
Fly manually with your own drones or automate with the DJI Dock 3: DATACT supports both.
Check out
DATACT

Map-based image management and discovery
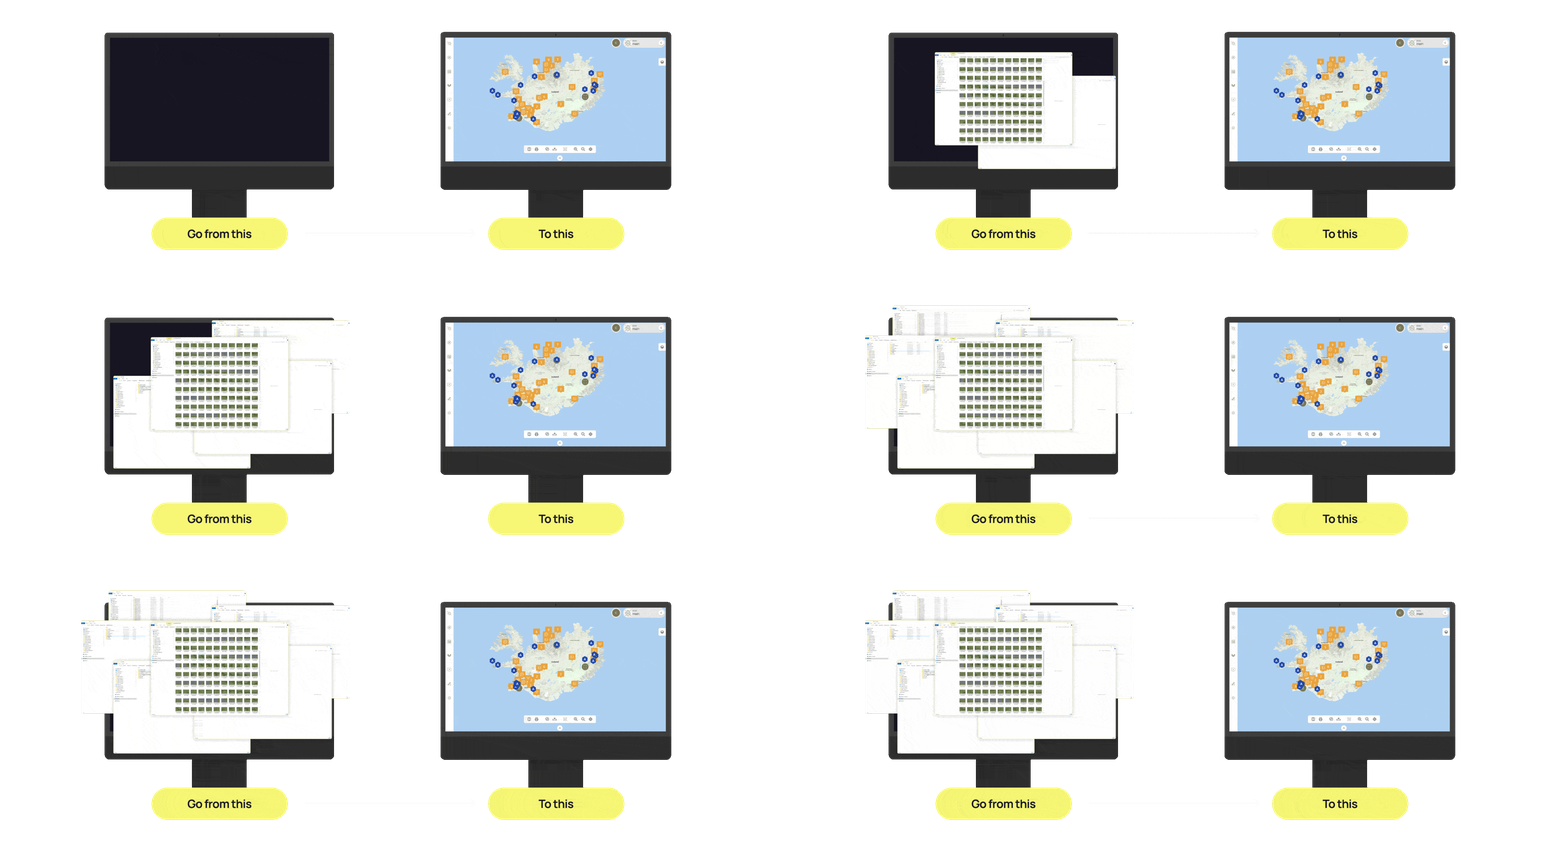
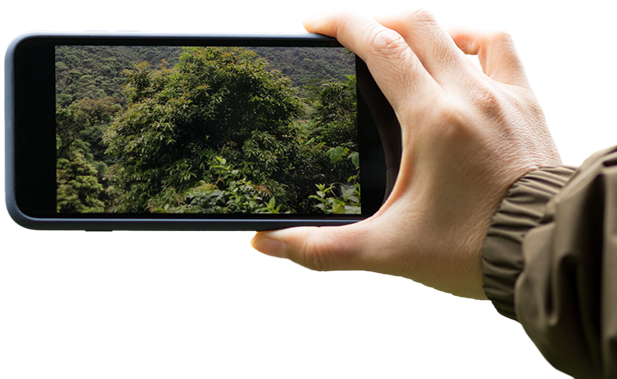
DATACT lets you drag and drop your photos directly onto the map — from drones, phones, or 360° cameras. Each image automatically appears in its correct location, so you can find what you need by place, not by folder. It’s a smarter, visual way to connect ground imagery with your geospatial data and keep everything organized in one intuitive workspace.
Key features
Drag-and-drop simplicity – Upload photos from drones or phones directly onto the map; DATACT automatically positions them using GPS data.
Map-first search – Browse and locate images visually by zooming into the area where work took place instead of searching through project folders.
Connect ground and spatial data – Link on-site images with maps, orthophotos, and 3D models to understand what’s happening both on the ground and from above.
Powerful filtering – Instantly filter by date, time, or keywords from image names and descriptions.
Visual context – Eliminate the need to remember project names or locations; everything is stored where it was captured.
Collaboration ready – Share filtered map views or image collections securely with your team, your clients or external partners.
Secure and centralized – All imagery stays safely managed within DATACT, stored on European servers with controlled access.
Benefits
Save time – Locate the right image in seconds instead of digging through endless folders.
See the full picture – Combine aerial, ground, and map data to gain true spatial understanding.
Improve collaboration – Give everyone access to the same visual information in a shared map environment.
Simplify workflows – Organize, search, and analyze images and geospatial data in one place.
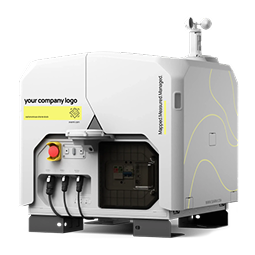
Drone in a box:
integration with DJI Dock 3
DATACT integration: your newest teammate, ready for work.

Flexible options
Flexible access
No technical setup required
All permits handled
Seamless operation
Quick deployment
Your benefits
Automatic data capture
Instant response capability
Detailed visual outputs
Accurate & measurable data
Secure cloud access
Collaborative visibility
Zero setup time
Automated drone
& charging
Automated data capture
& visual data
DATACT platform
Insight
Sofortiger Zugriff auf Satellitendaten
Mit DATACT können Benutzer nahtlos auf hochauflösende Satellitenbilder zugreifen, um ihre Feld- und Drohnendaten zu ergänzen. Sehen Sie sich aktuelle und historische Satellitenaufnahmen Ihrer Interessengebiete an, um Veränderungen im Laufe der Zeit zu überwachen, Umweltbedingungen zu beurteilen oder Lücken zwischen den Besuchen vor Ort zu schließen. Dieser integrierte Zugriff bietet eine breitere, konsistente Perspektive auf Ihre Naturdaten-Workflows — ohne die Plattform verlassen zu müssen.
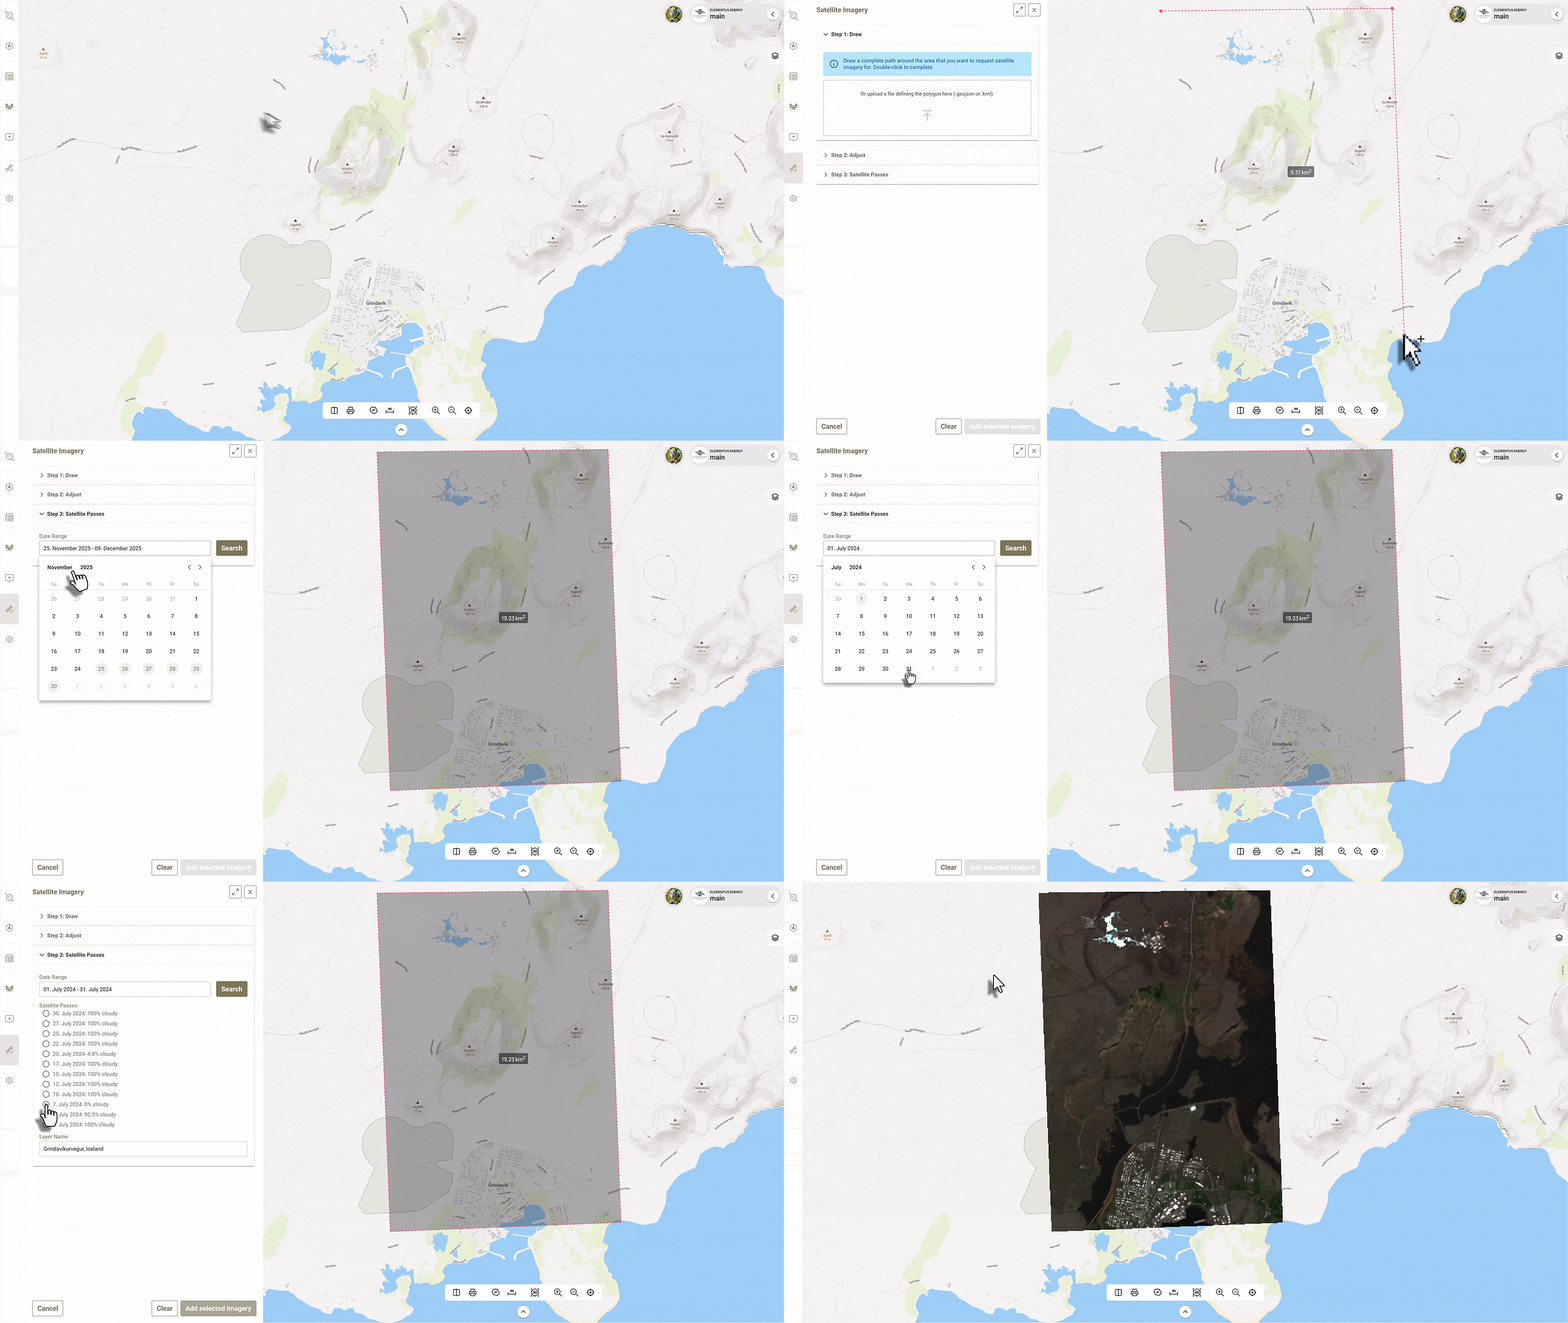
Instant access – View recent and historical satellite imagery for any location in seconds.
Unified data – Combine satellite, drone, and ground data in one interactive map.
Monitor change – Track construction progress, vegetation, land use or environmental change over time.
Context between site visits – Fill gaps and maintain awareness even when you’re not on location.
No setup required – Satellite layers are integrated directly into DATACT; simply turn them on.
Assets
Spatial management of your projects and infrastructure
The Assets feature in DATACT lets you visualize and manage all your assets directly on the map. Each asset appears as a blue hexagon, making it easy to locate and organize even large networks of sites or projects. Assets can represent physical infrastructure, facilities, or project areas — from power lines, roads, wind turbines and substations to wetlands and restoration zones.
With Assets, you can define, update, and analyze the geographic footprint of each site, monitor areas of interest, and understand how they interact with environmental and regulatory layers — all in one spatial workspace.
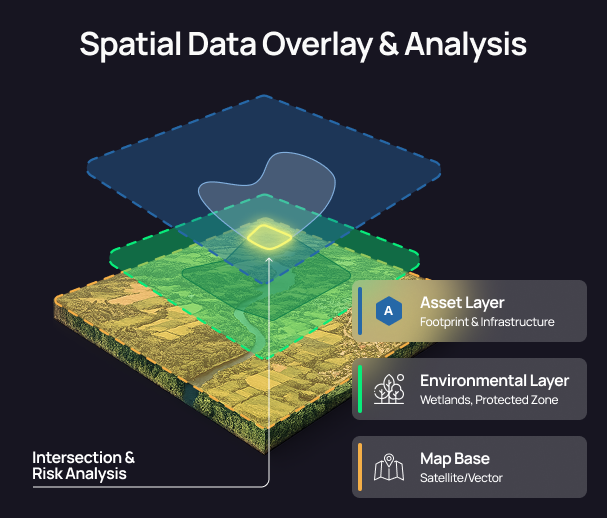
What you can do
Visualize your assets on the map – Every asset is displayed as a blue hexagon, giving a clear overview of all locations in one unifiedmap view.
Represent infrastructure or projects –Use assets to mark physical assets (e.g., power stations, roads, buildings) or project areas(e.g., conservation sites, restoration zones).
Define asset-related areas – Add and manage vector areas directly connected to each asset for deeper spatial insight.
Upload or draw areas – Create boundaries manually on the map or upload your own vector files (e.g., GeoJSON, SHP, KML).
Overlay with geospatial data – Compare your asset areas with layers like protected areas, vegetation cover, hydrology, or land use to identify overlaps and risks.
Store related files – Attach and organize documents, photos, or datasets directly to each asset for centralized access.
Area types in assets
Asset footprint – Defines the land area belonging to or representing the asset (e.g., ownership boundary or project extent). Only one footprint can be active at a time — helping teams ensure they’re always working with the most up-to-date boundary, while keeping older versions for reference.
Monitoring area – Create multiple active monitoring zones to define areas that require focused observation or data collection.
Area of influence – Define areas around the asset that are significantly affected by its presence or activity (e.g., environmental impact zones).
Why it matters
See everything in one place – Eliminate the need to search for folders or outdated maps; all assets and their areas live on the map.
Overlay with geospatial data – Compare your asset areas with layers like protected areas, vegetation cover, hydrology, or land use to identify overlaps and risks.
Store related files – Attach and organize documents, photos, or datasets directly to each asset for centralized access.
Collaborate easily – Teams can access and update asset information from anywhere, reducing confusion and duplication.
Connect data to location – Every file, dataset, and note linked directly to its geographic context.
Collaboration & data sharing
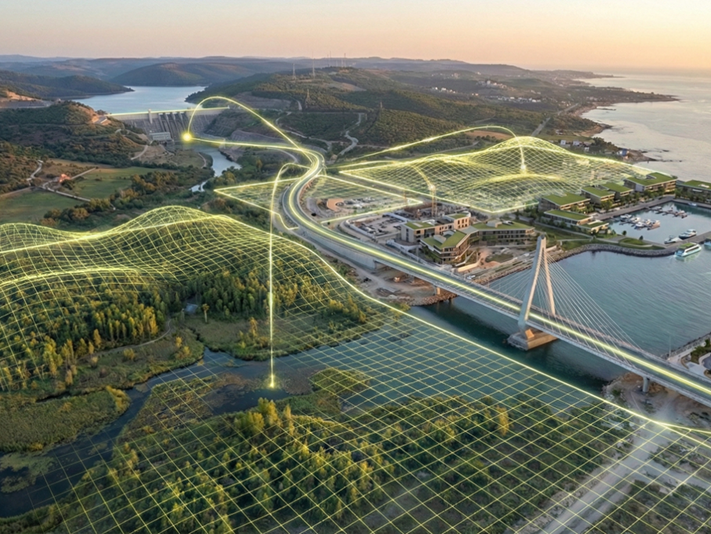
DATACT brings everyone around a site onto the same map: your team, your clients, drone operators, contractors, consultants and authorities. It eliminates data silos by making all your imagery, maps, and geospatial data accessible in one secure platform. Share information, collaborate in real time, and manage access effortlessly — without endless file transfers or lost data.
“One place for your data, your team,
and your partners — working
together in real time.”
Team-based workspaces
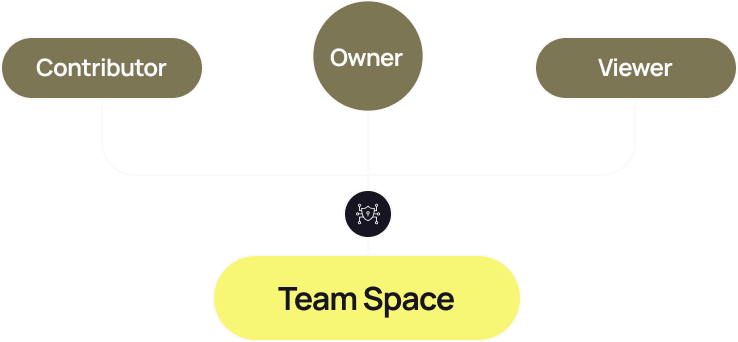
Each organization has a shared Team Space where all members can access and contribute to data. Roles like Owner, Contributor, and Viewer control permissions — whether you are a drone operator serving dozens of clients or a utility with hundreds of users.
Channels for collaboration
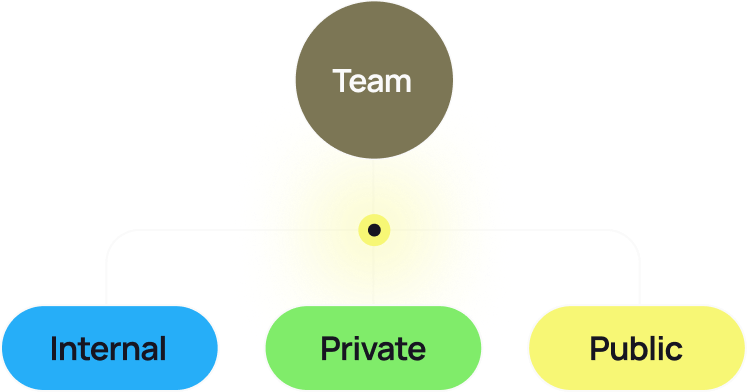
Channels are interactive workspaces — think of them as maps for teamwork.
Internal channels: For your company-wide collaboration. Everyone in your team can join, explore, and add data.
Private channels: Perfect for sensitive or early-stage work — only invited members can view and contribute.
Public channels: Share your work with external stakeholders or the public through simple links, with full control over visibility and downloads.
Invite external collaborators
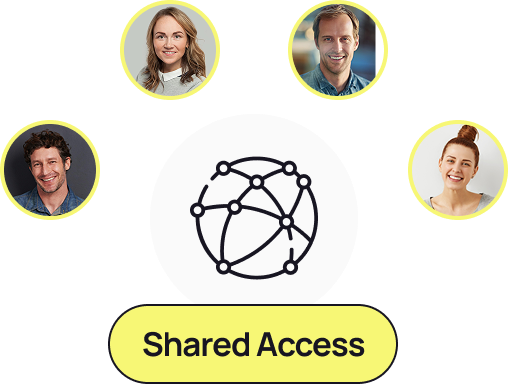
Easily invite clients, contractors, consultants, or partners to specific channels — letting them upload or access data without full platform access. Collaboration stays focused, controlled, and traceable.
Secure data sharing at scale
DATACT handles large datasets — tens or hundreds of gigabytes — that traditional file sharing can’t. Instead of uploading and downloading repeatedly, your data lives securely in one place, instantly available to authorized users.
Integration with GIS systems
Stream data directly to other GIS platforms using secure WMS links authenticated with your API key. Keep your spatial workflows connected — no need to re-upload or duplicate data.
Why it matters
End data silos – connect teams, contractors, and stakeholders in one shared environment.
Save time – no repeated uploads or file transfers; everyone accesses the same source of truth.
Stay secure – control exactly who sees what, with flexible channel permissions.
Share effortlessly – generate shareable links for internal, private, or public access.
Collaborate visually – work together directly on the map — not in folders.
Geoservices
Complete context, layer by layer
Stream public and private map data directly over your drone imagery.
Don’t just look at your site; understand it. DATACT lets you overlay external geo-services (WMS, WMTS, WFS) directly onto your own high-res drone imagery. Visualize underground infrastructure like district heating pipes right on top of your thermal surveys, define precise asset zones (Area of Influence, Monitoring Areas), and see the full picture in seconds.
What are geoservices?
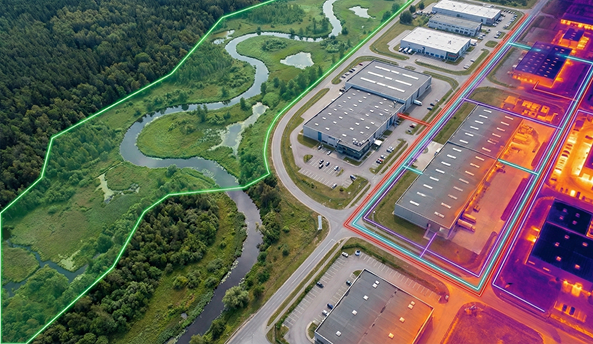
Think of them like "live streams" for maps. Instead of downloading huge files, DATACT lets you stream map layers directly over the internet.
- Public Data: Instantly view free government layers like property lines, flood zones, or utility networks.
- Private Data: Securely connect your team’s own GIS databases to see your internal engineering or asset data. It’s instant, live, and always up to date.
Scalable plans
for every workflow
Essential
For drone operators and project teams getting started with drone and field data
- 3 internal users
- 1 guest user
- 1 public channel
- 50 cloud processed images/month
- 250 GB of storage
Professional
For drone service providers and asset teams with frequent missions and many stakeholders
- 10 internal users
- 5 guest users
- 5 public channels
- 500 cloud processed images/month
- 1 TB of storage
Enterprise
For utilities, infrastructure owners and large organisations: SSO, custom integrations and premium support
- Domain-enforced single sign-on (SSO)
- Custom layers (WMS/WFS)
- GCP processing
- Unlimited internal users
- Unlimited guest users
- Unlimited public channels
- Contract based cloud processed images
- Custom storage options
Compare plans
Find the perfect plan for you
Questions we hear every week
Who is DATACT for?
Drone operators who deliver mapping and survey data to clients, infrastructure owners and utilities who manage assets across many sites, and environmental teams who monitor nature and report to authorities. All of them work on the same map.
Do I need my own drone?
No. Fly your own drone, work with a local drone operator, or let Svarmi collect the data for you. DATACT also integrates with the DJI Dock 3 for automated drone-in-a-box flights.
Can clients and partners see the data without buying a licence?
Yes. Every plan includes guest users with access to specific channels, and public channels let you share results through a simple link, with full control over visibility and downloads.
Where is my data stored?
On European servers, with controlled access through Owner, Contributor and Viewer roles. After cancellation your data is kept for 100 days, and longer on Enterprise plans.
Does DATACT work with our GIS?
Yes. Bring in public and private WMS, WMTS and WFS layers, upload GeoJSON, SHP or KML files, and stream your DATACT maps into other GIS tools via secure WMS links on the Professional and Enterprise plans.
How does the DATACT Partner Programme work?
Sign up as a partner, get your own DATACT link and share it with your clients. You earn 15% of the revenue from every client who signs up through it, for their first 5 years.
Can I try it before I commit?
Yes. Start a free trial of the Essential or Professional plan online. For SSO, custom layers, GCP processing or large rollouts, contact sales@svarmi.com for an Enterprise offer.
Can Svarmi help us get started?
Yes. Since 2013 we have collected, migrated and analysed nature and infrastructure data across Europe and beyond. We can onboard your existing data, train your team or run the full workflow for you.
Fangen Sie an, Ihre Naturdaten für Sie arbeiten zu lassen
